Resumen de la Actividad
Creating a science poster or infographic is a fantastic way to showcase science topics in a compelling visual format! Not only are creating science posters lots of fun for students, they also provide teachers with a worthwhile assessment at the end of a unit! Students have to think critically to determine what facts and information to highlight and how to illustrate important connections between data.
Here are some ideas for science project topics for high school:
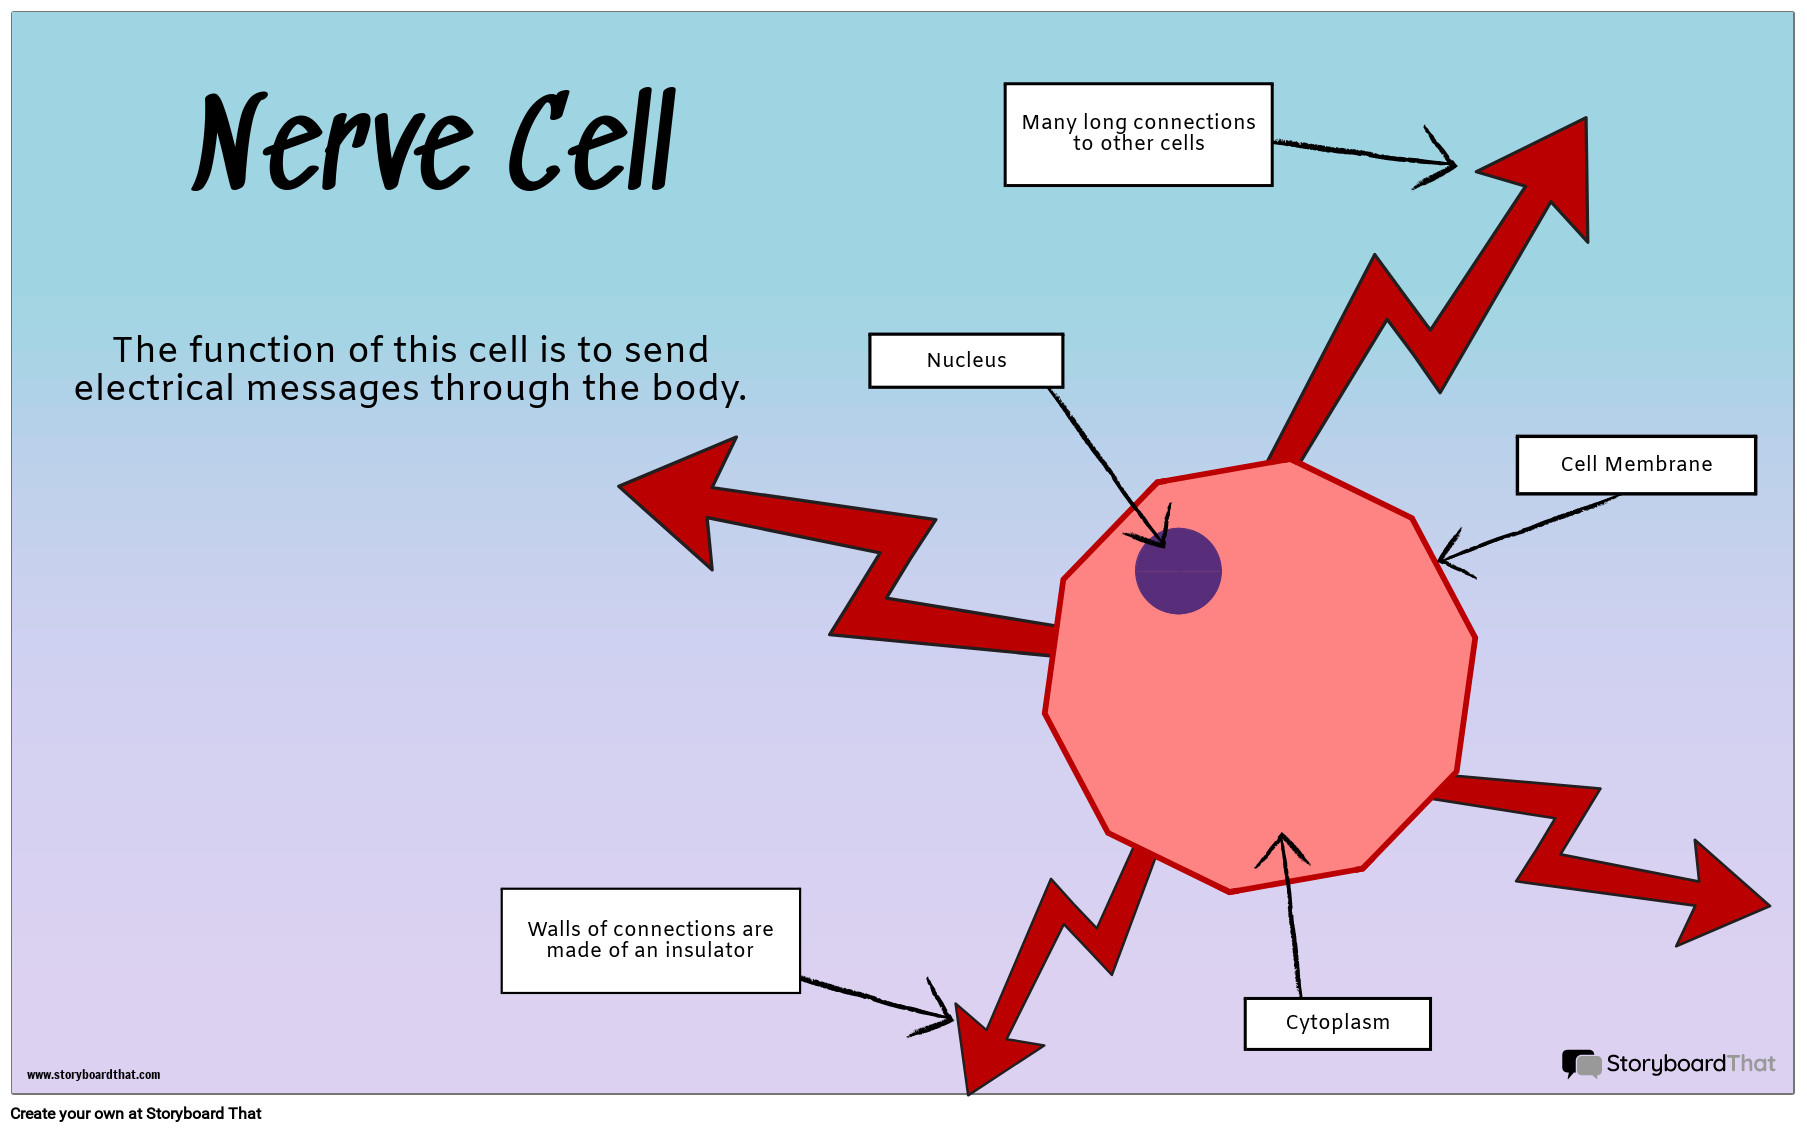
- Specialized Cells
- Basic Cells: Plant and Animal Cells
- The Carbon Cycle
- States of Matter
- The Digestive System
- Understanding Atomic Structures
- Renewable Energy
When finished, students' science posters can be printed, laminated, and hung around the classroom or school. Students can also project them onto the board and present their findings to their classmates, adding a public speaking component to the project. Teachers may wish to organize a "gallery walk" where students have the opportunity to walk around as if they are at the Science Museum!
Teachers, don't forget, you can add as many templates to your assignments as you wish! For additional templates to add to this assignment, check out our Science Infographic Templates, Science Fair Poster templates, PSA Infographic Templates or our Entire Infographic Gallery!
Instrucciones de Plantilla y Clase
(Estas instrucciones son completamente personalizables. Después de hacer clic en "Copiar actividad", actualice las instrucciones en la pestaña Editar de la tarea).
Due Date:
Objective: Create an infographic to display your understanding of a topic
Student Instructions:
- Using your research, add important facts and details to the infographic template.
- Change fonts, colors, or styles how you wish.
- Add imagery to enhance your poster.
- Be sure to include at least 10 important facts to demonstrate what you have learned from your research.
- Save and exit when you're finished.
Referencia del Plan de Lección
Rúbrica
(También puede crear el suyo propio en Quick Rubric ).
| Competente | Emergente | Comenzando | |
|---|---|---|---|
| Visualización | El guión gráfico ilustra claramente una celda que es adecuada para la función especificada. | El guión gráfico ilustra una celda que es muy adecuada para la función especificada, pero es difícil de entender. | La celda del guión gráfico no ilustra claramente una celda que es adecuada para la función especificada. |
| Identificación de Componentes | El diagrama de celda está claramente etiquetado mostrando cómo se adapta bien a su función. | El diagrama de celda está etiquetado. | El diagrama de celda no está etiquetado. |
| Evidencia de Esfuerzo | El trabajo está bien escrito y cuidadosamente pensado. | El trabajo muestra alguna evidencia de esfuerzo. | El trabajo muestra poca evidencia de algún esfuerzo. |
Más Storyboard That Actividades
Proyectos de Secundaria
Precios Para Escuelas y Distritos
© 2024 - Clever Prototypes, LLC - Reservados todos los derechos.
StoryboardThat es una marca registrada de Clever Prototypes , LLC y registrada en la Oficina de Patentes y Marcas de EE. UU.


