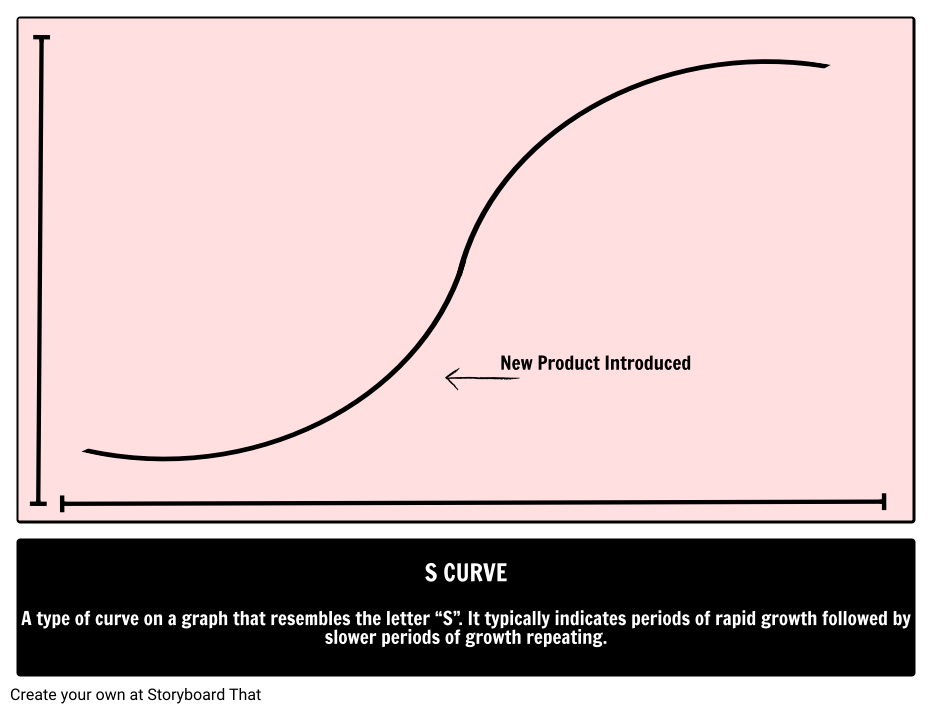
A type of curve on a graph that resembles the letter "S". It typically indicates periods of rapid growth followed by slower periods of growth repeating.
An S curve shows the growth of one variable (usually money) in terms of a second variable (usually time). For example, an S curve could represent sales over time. The steep section of growth represents when a company launched a new product. At this point in time, they attracted many new customers and sales numbers were above average. As time went on, the new customers began to taper off and sales numbers steadily decreased and normality returned. This represents the tail end of the S curve, otherwise known as the upper asymptote. Knowing the meaning behind an S curve is important and allows businesses to recognize that times of extreme growth will not last, nor will times of stagnation.
© 2024 - Clever Prototypes, LLC - All rights reserved.
StoryboardThat is a trademark of Clever Prototypes, LLC, and Registered in U.S. Patent and Trademark Office


