Activity Overview
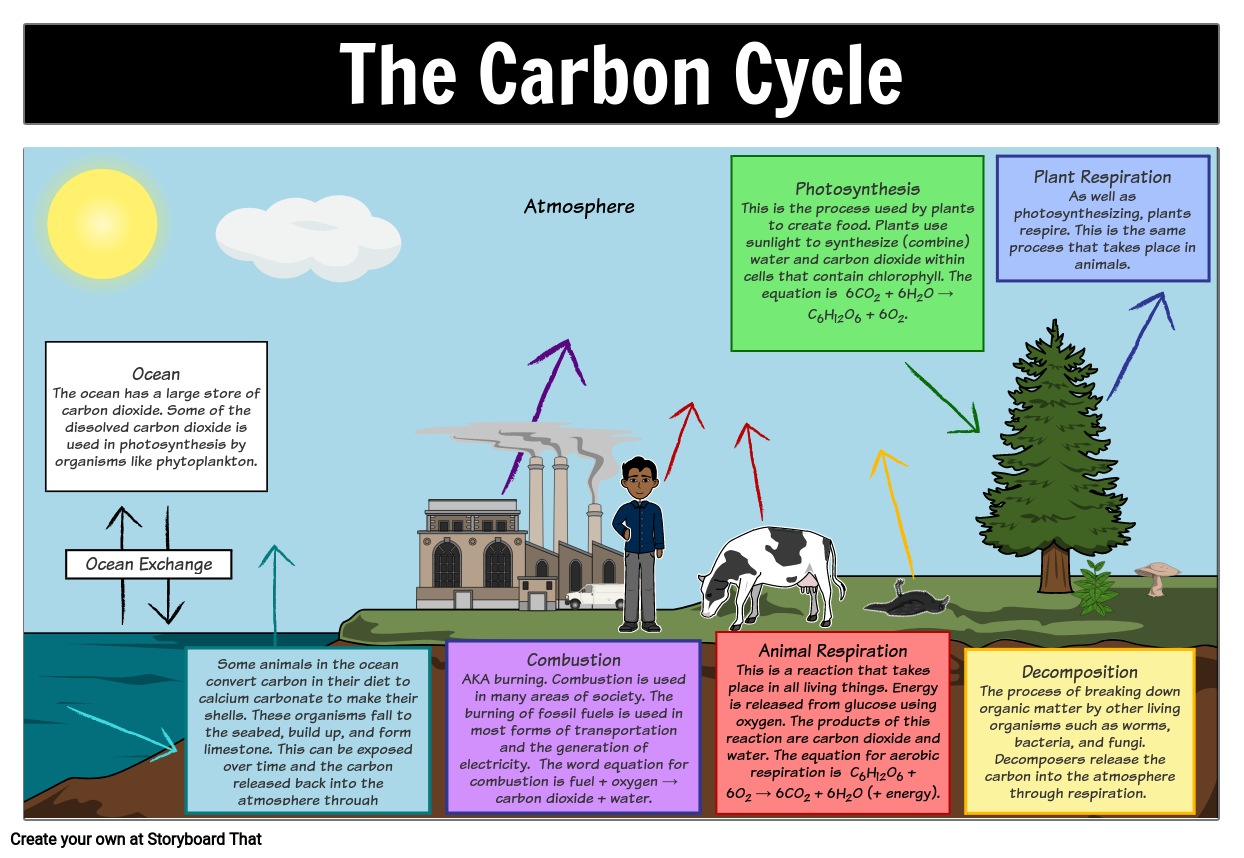
When learning about the processes in the carbon cycle, it can be extremely helpful for students to create a diagram! In this activity, students will create a carbon cycle diagram and show the movement of carbon through the cycle. Students should also explain each process in their diagram. The finished posters can be printed out or used as a presentation!
You can modify this activity by giving students a list of processes to include in the their diagrams or provide them with a scene already in place and have them fill in the labels. Extend this activity by having students examine what happens when the organic remains don’t decompose and fossil fuels are made.
Template and Class Instructions
(These instructions are completely customizable. After clicking "Copy Activity", update the instructions on the Edit Tab of the assignment.)
Student Instructions
You are going to use your knowledge of the Carbon Cycle to create your own model on Storyboard That.
- Click "Start Assignment".
- Find an appropriate scene to show the carbon cycle. Add characters and items as necessary.
- Use arrows to show the movement of carbon in the carbon cycle among the atmosphere, biosphere, hydrosphere and geosphere.
- Label the main parts of the carbon cycle with Textables and arrows.
- Add extra information about the carbon cycle with text boxes. You should describe what is happening at each stage.
Lesson Plan Reference
- SCI-HS-LS2-5 - Develop a model to illustrate the role of photosynthesis and cellular respiration in the cycling of carbon among the biosphere, atmosphere, hydrosphere, and geosphere.
Rubric
(You can also create your own on Quick Rubric.)
| Proficient | Emerging | Beginning | |
|---|---|---|---|
| Arrows | All the arrows are correctly showing how carbon moves among the atmosphere, biosphere, hydrosphere and geosphere. | Most of the arrows are correctly showing how carbon moves among the atmosphere, biosphere, hydrosphere and geosphere. | Some of the arrows are correctly showing how carbon moves among the atmosphere, biosphere, hydrosphere and geosphere |
| Processes | All the process descriptions are correct with no grammar or spelling mistakes and they include good scientific vocabulary. | Most of the process descriptions are correct with some grammar and spelling mistakes. | Some of the process descriptions are correct with many grammar and spelling mistakes. |
| Model | The model clearly represents the carbon cycle. | The model represents the cycle but some parts are difficult to understand. | The model does not represent the carbon cycle. |
| Evidence of Effort | Work is well written and carefully thought out. | Work shows some evidence of effort. | Work shows little evidence of any effort. |
How To Help Students Create a 3D Model to Show the Working of Carbon Cycle
Discuss the Working of the Carbon Cycle
Before working on the model, theoretically explain each process involved in the carbon cycle in detail. Explain the sequence of events and their significance to students so they have an idea of how to represent this process in a model. Teachers can also show some examples of models available online just to provide students with some guidance.
Divide into Groups
Divide the class into 3-4 students and provide each group with some individual guidance and discuss how they want to move forward with the project. Encourage the students to be creative and collaborative so they can learn to work in a team setting.
Introduce Mind Mapping
Introduce students to the idea of mind mapping and how they can use this concept to draw an outline of the model and organize their thoughts. Mind mapping can also help the students to structure the information they want to put in the model.
Gather Resources
Give the students a basic idea of the supplies they will require to make the model. This can consist of materials like construction paper, clay or modeling paste, markers, labels, scissors, glue, and any other pertinent creative equipment. Encourage the students to expand their imagination and use simple materials creatively to create something outstanding.
Work on the Design
Tell the groups to start building their models based on their designs. Plants, animals, the atmosphere, the oceans, the soil, and other necessary elements may all be built using the resources that are easily available. For their convenience, students can first draw a model on the paper.
Organize a Model Showcase Gallery
To show off the students' hard work and act as a visual teaching aid, exhibit the models in the classroom or a public space, if possible. Teachers can invite some external audience such as teachers of other subjects to evaluate the projects and give some sort of prize to the top three models.
Frequently Asked Questions About Creating a Carbon Cycle Diagram
How can students visually represent a carbon cycle?
An illustration of the transportation of carbon through different elements of the Earth's ecosystem, such as the atmosphere, living things, soil, and seas, can be seen through a carbon cycle diagram. Students can make these diagrams and add their own creative and storytelling elements to make the diagram more engaging and interesting.
What is the significance of plants in the carbon cycle?
Through photosynthesis, plants have a significant impact on the carbon cycle. They take in carbon dioxide from the atmosphere and transform it into organic molecules, producing oxygen as a byproduct in the process. This oxygen is crucial to the survival of humans and many other environmental processes.
More Storyboard That Activities
Carbon Cycle
Testimonials
Introductory School Offer
ONLY$500
- 1 School
- 5 Teachers for One Year
- 1 Hour of Virtual PD
30 Day Money Back Guarantee • New Customers Only • Full Price After Introductory Offer • Access is for 1 Calendar Year
© 2025 - Clever Prototypes, LLC - All rights reserved.
StoryboardThat is a trademark of Clever Prototypes, LLC, and Registered in U.S. Patent and Trademark Office


