Aktivitetsoversikt
Creating a science poster or infographic is a fantastic way to showcase science topics in a compelling visual format! Not only are creating science posters lots of fun for students, they also provide teachers with a worthwhile assessment at the end of a unit! Students have to think critically to determine what facts and information to highlight and how to illustrate important connections between data.
Here are some ideas for science project topics for high school:
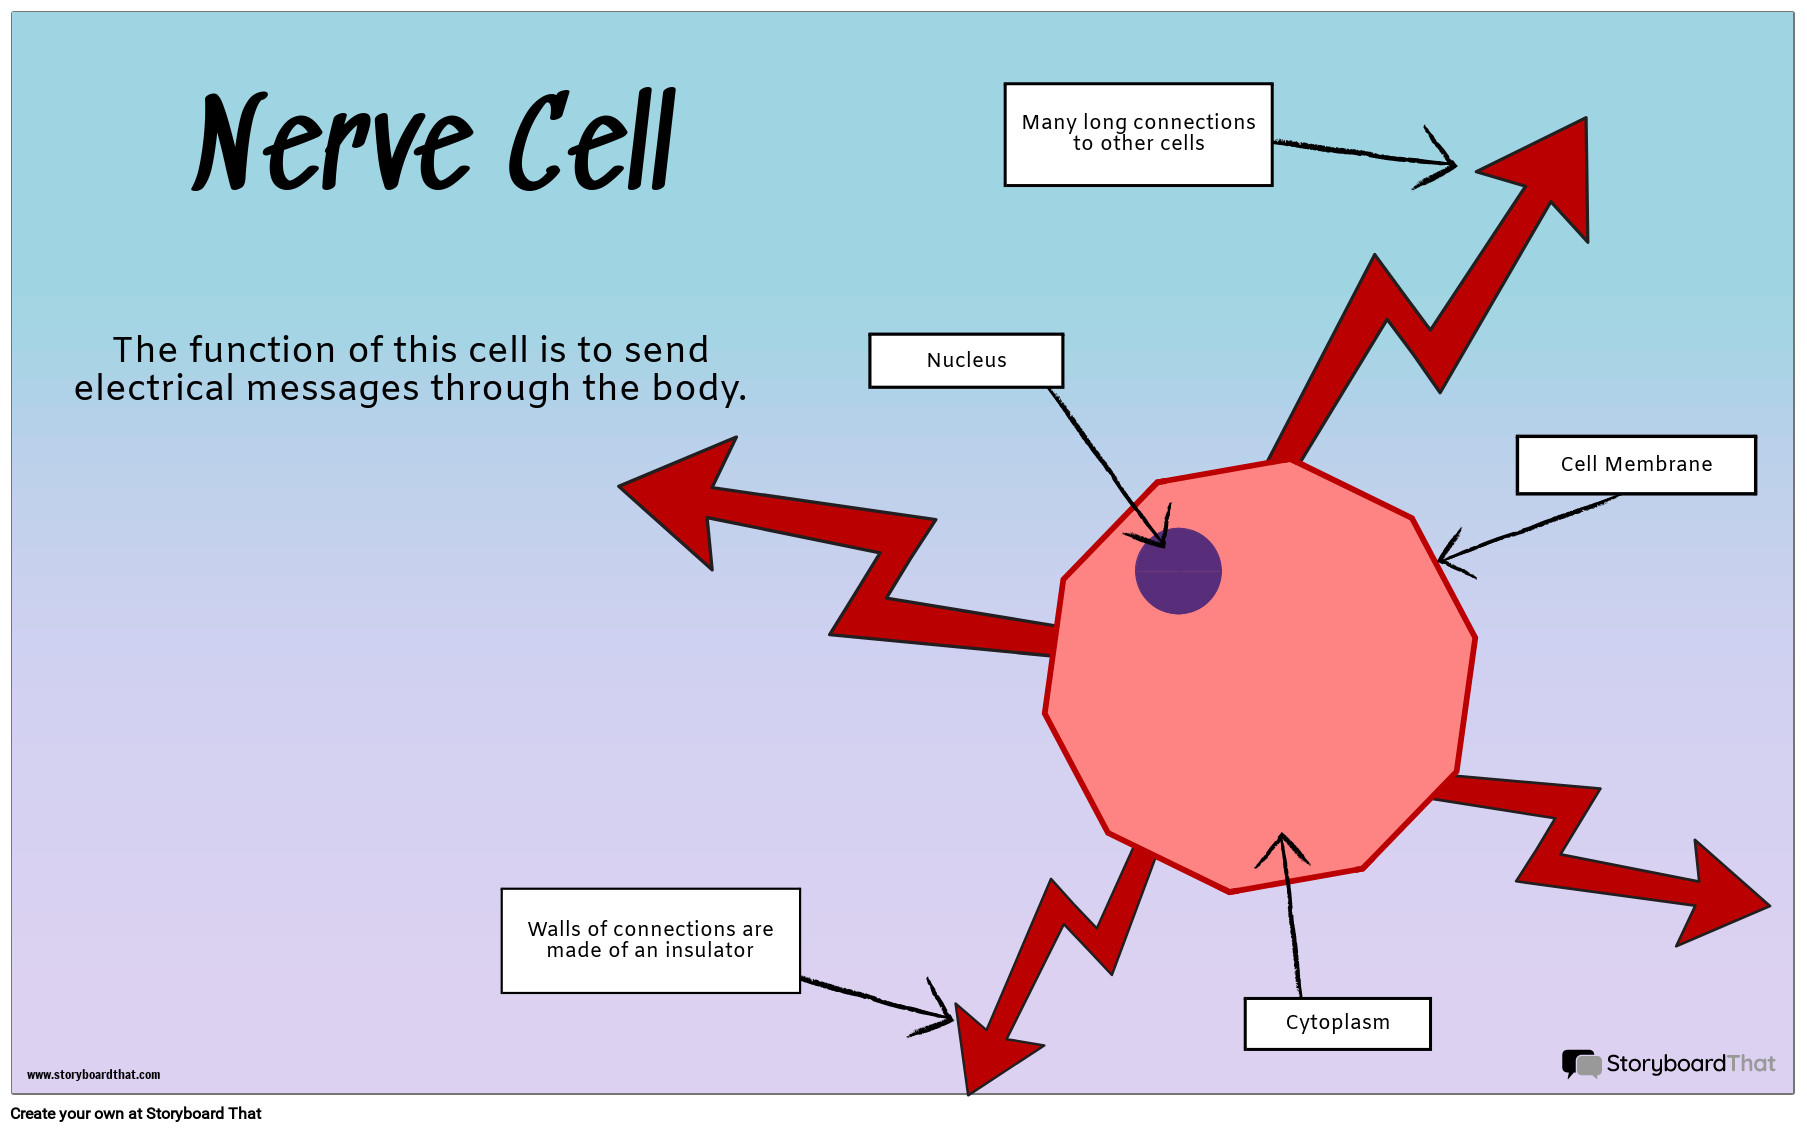
- Specialized Cells
- Basic Cells: Plant and Animal Cells
- The Carbon Cycle
- States of Matter
- The Digestive System
- Understanding Atomic Structures
- Renewable Energy
When finished, students' science posters can be printed, laminated, and hung around the classroom or school. Students can also project them onto the board and present their findings to their classmates, adding a public speaking component to the project. Teachers may wish to organize a "gallery walk" where students have the opportunity to walk around as if they are at the Science Museum!
Teachers, don't forget, you can add as many templates to your assignments as you wish! For additional templates to add to this assignment, check out our Science Infographic Templates, Science Fair Poster templates, PSA Infographic Templates or our Entire Infographic Gallery!
Mal og Klasse Instruksjoner
(Disse instruksjonene kan tilpasses fullstendig. Etter å ha klikket på "Kopier aktivitet", oppdater instruksjonene på Rediger-fanen i oppgaven.)
Due Date:
Objective: Create an infographic to display your understanding of a topic
Student Instructions:
- Using your research, add important facts and details to the infographic template.
- Change fonts, colors, or styles how you wish.
- Add imagery to enhance your poster.
- Be sure to include at least 10 important facts to demonstrate what you have learned from your research.
- Save and exit when you're finished.
Leksjon Plan Reference
Rubrikk
(Du kan også lage dine egne på Quick Rubric.)
| Dyktig | Emerging | Begynnelse | |
|---|---|---|---|
| Visualisering | Fortellingsbrettet illustrerer tydelig en celle som passer godt til den angitte funksjonen. | Historien viser en celle som passer godt til den angitte funksjonen, men er vanskelig å forstå. | Historiebrettet illustrerer ikke tydelig en celle som passer godt til den angitte funksjonen. |
| Identifikasjon av Komponenter | Cellediagrammet er tydelig merket og viser hvordan det passer godt til funksjonen. | Cellediagrammet er merket. | Cellediagrammet er ikke merket. |
| Bevis på Innsats | Arbeidet er godt skrevet og nøye gjennomtenkt. | Arbeid viser noe bevis på innsats. | Arbeid viser lite bevis på innsats. |
Mer Storyboard That Aktiviteter
Videregående Skoleprosjekter
Priser for Skoler og Distrikter
© 2024 - Clever Prototypes, LLC - Alle rettigheter forbeholdt.
StoryboardThat er et varemerke for Clever Prototypes , LLC , og registrert i US Patent and Trademark Office


