Przegląd Działań
Creating a science poster or infographic is a fantastic way to showcase science topics in a compelling visual format! Not only are creating science posters lots of fun for students, they also provide teachers with a worthwhile assessment at the end of a unit! Students have to think critically to determine what facts and information to highlight and how to illustrate important connections between data.
Here are some ideas for science project topics for high school:
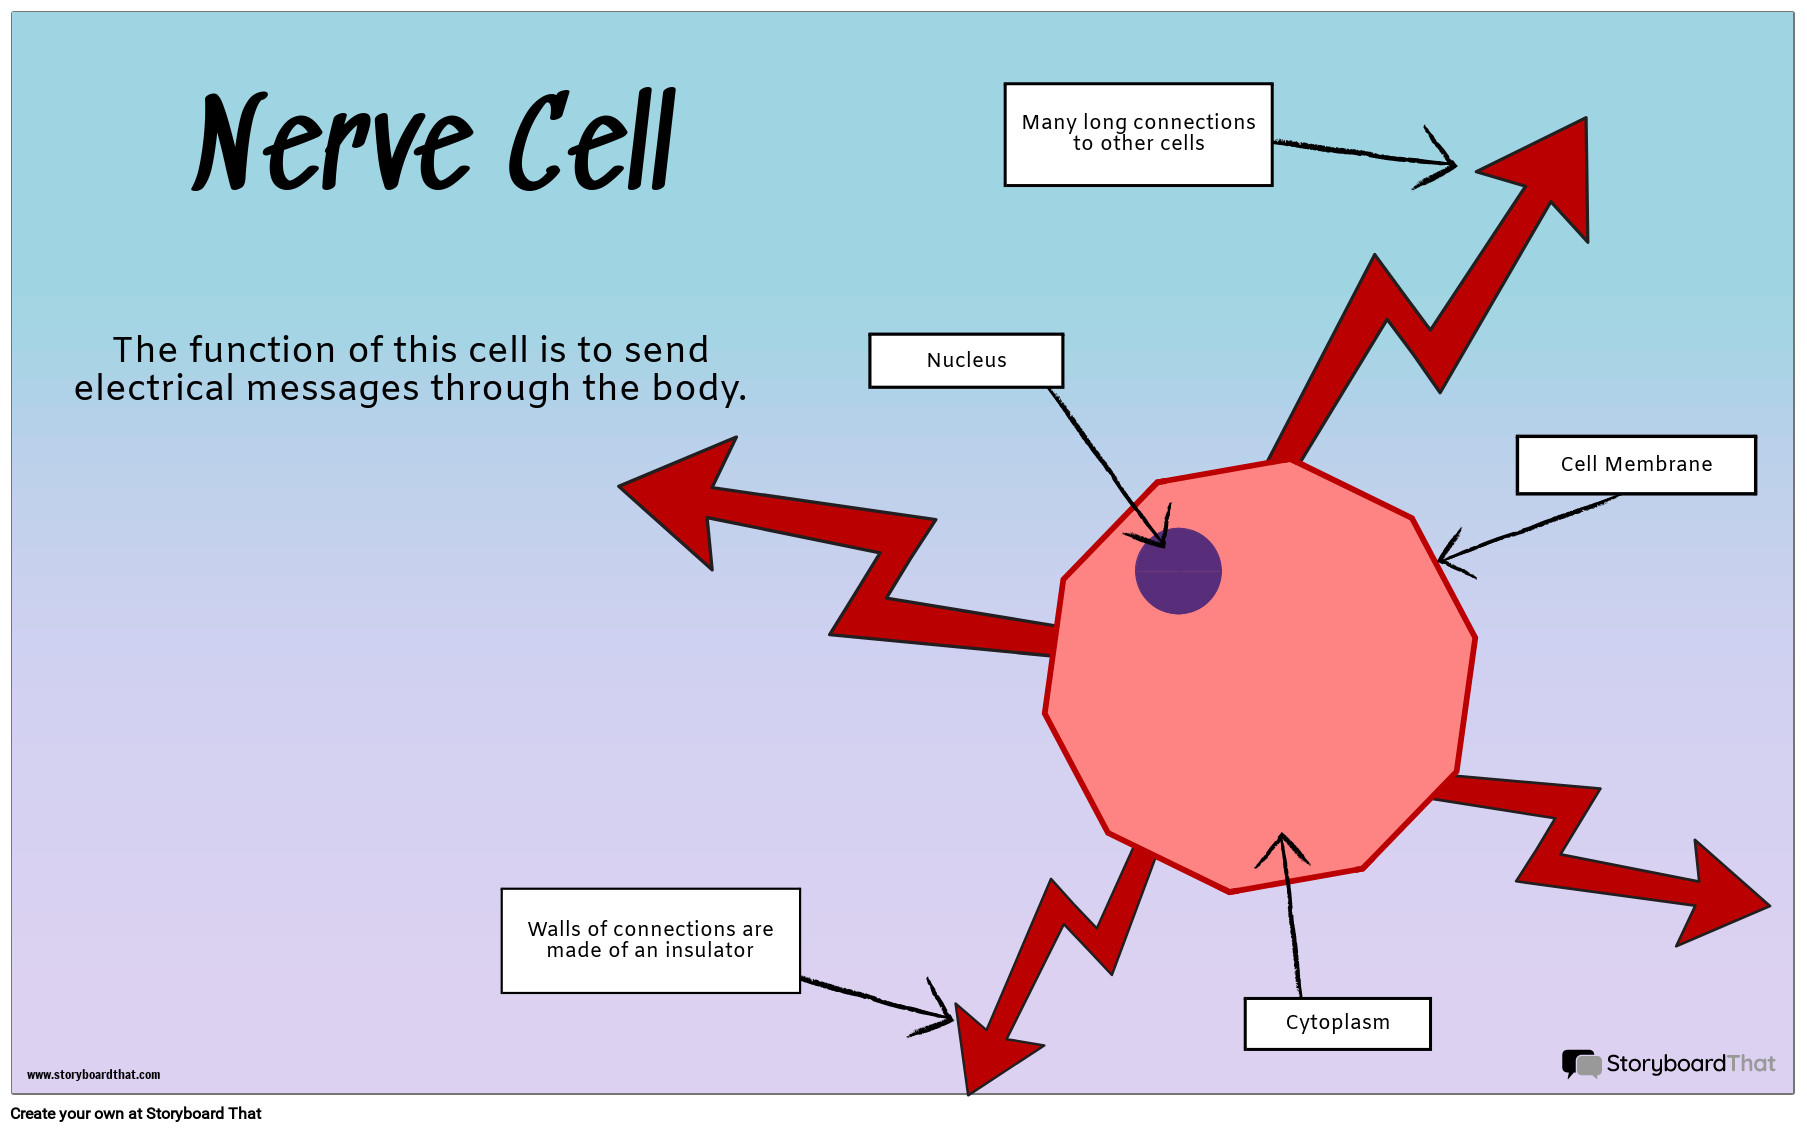
- Specialized Cells
- Basic Cells: Plant and Animal Cells
- The Carbon Cycle
- States of Matter
- The Digestive System
- Understanding Atomic Structures
- Renewable Energy
When finished, students' science posters can be printed, laminated, and hung around the classroom or school. Students can also project them onto the board and present their findings to their classmates, adding a public speaking component to the project. Teachers may wish to organize a "gallery walk" where students have the opportunity to walk around as if they are at the Science Museum!
Teachers, don't forget, you can add as many templates to your assignments as you wish! For additional templates to add to this assignment, check out our Science Infographic Templates, Science Fair Poster templates, PSA Infographic Templates or our Entire Infographic Gallery!
Szablony i Instrukcje Klasowe
(Te instrukcje są w pełni konfigurowalne. Po kliknięciu „Kopiuj działanie”, zaktualizuj instrukcje na karcie Edytuj zadania.)
Due Date:
Objective: Create an infographic to display your understanding of a topic
Student Instructions:
- Using your research, add important facts and details to the infographic template.
- Change fonts, colors, or styles how you wish.
- Add imagery to enhance your poster.
- Be sure to include at least 10 important facts to demonstrate what you have learned from your research.
- Save and exit when you're finished.
Referencje Planu Lekcji
Rubryka
(Możesz również tworzyć własne w Quick Rubric ).
| Biegły | Pojawiające się | Początek | |
|---|---|---|---|
| Wyobrażanie Sobie | Scenorys wyraźnie ilustruje komórkę, która dobrze pasuje do określonej funkcji. | Scenorys ilustruje komórkę, która dobrze pasuje do określonej funkcji, ale jest trudna do zrozumienia. | Komórka storyboardu nie ilustruje wyraźnie komórki, która dobrze pasuje do określonej funkcji. |
| Identyfikacja Komponentów | Schemat komórki jest wyraźnie oznaczony, pokazując, jak dobrze pasuje do jego funkcji. | Schemat komórki jest oznakowany. | Schemat komórki nie jest oznaczony. |
| Dowód Wysiłku | Praca jest dobrze napisana i starannie przemyślana. | Praca wykazuje pewne dowody wysiłku. | Praca wykazuje niewielkie oznaki jakiegokolwiek wysiłku. |
Więcej Storyboard That dla Których Działania
Projekty Szkół Średnich


Cennik dla Szkół i Okręgów
© 2024 - Clever Prototypes, LLC - Wszelkie prawa zastrzeżone.
StoryboardThat jest znakiem towarowym firmy Clever Prototypes , LLC , zarejestrowanym w Urzędzie Patentów i Znaków Towarowych USA


