Panoramica Delle Attività
Creating a science poster or infographic is a fantastic way to showcase science topics in a compelling visual format! Not only are creating science posters lots of fun for students, they also provide teachers with a worthwhile assessment at the end of a unit! Students have to think critically to determine what facts and information to highlight and how to illustrate important connections between data.
Here are some ideas for science project topics for high school:
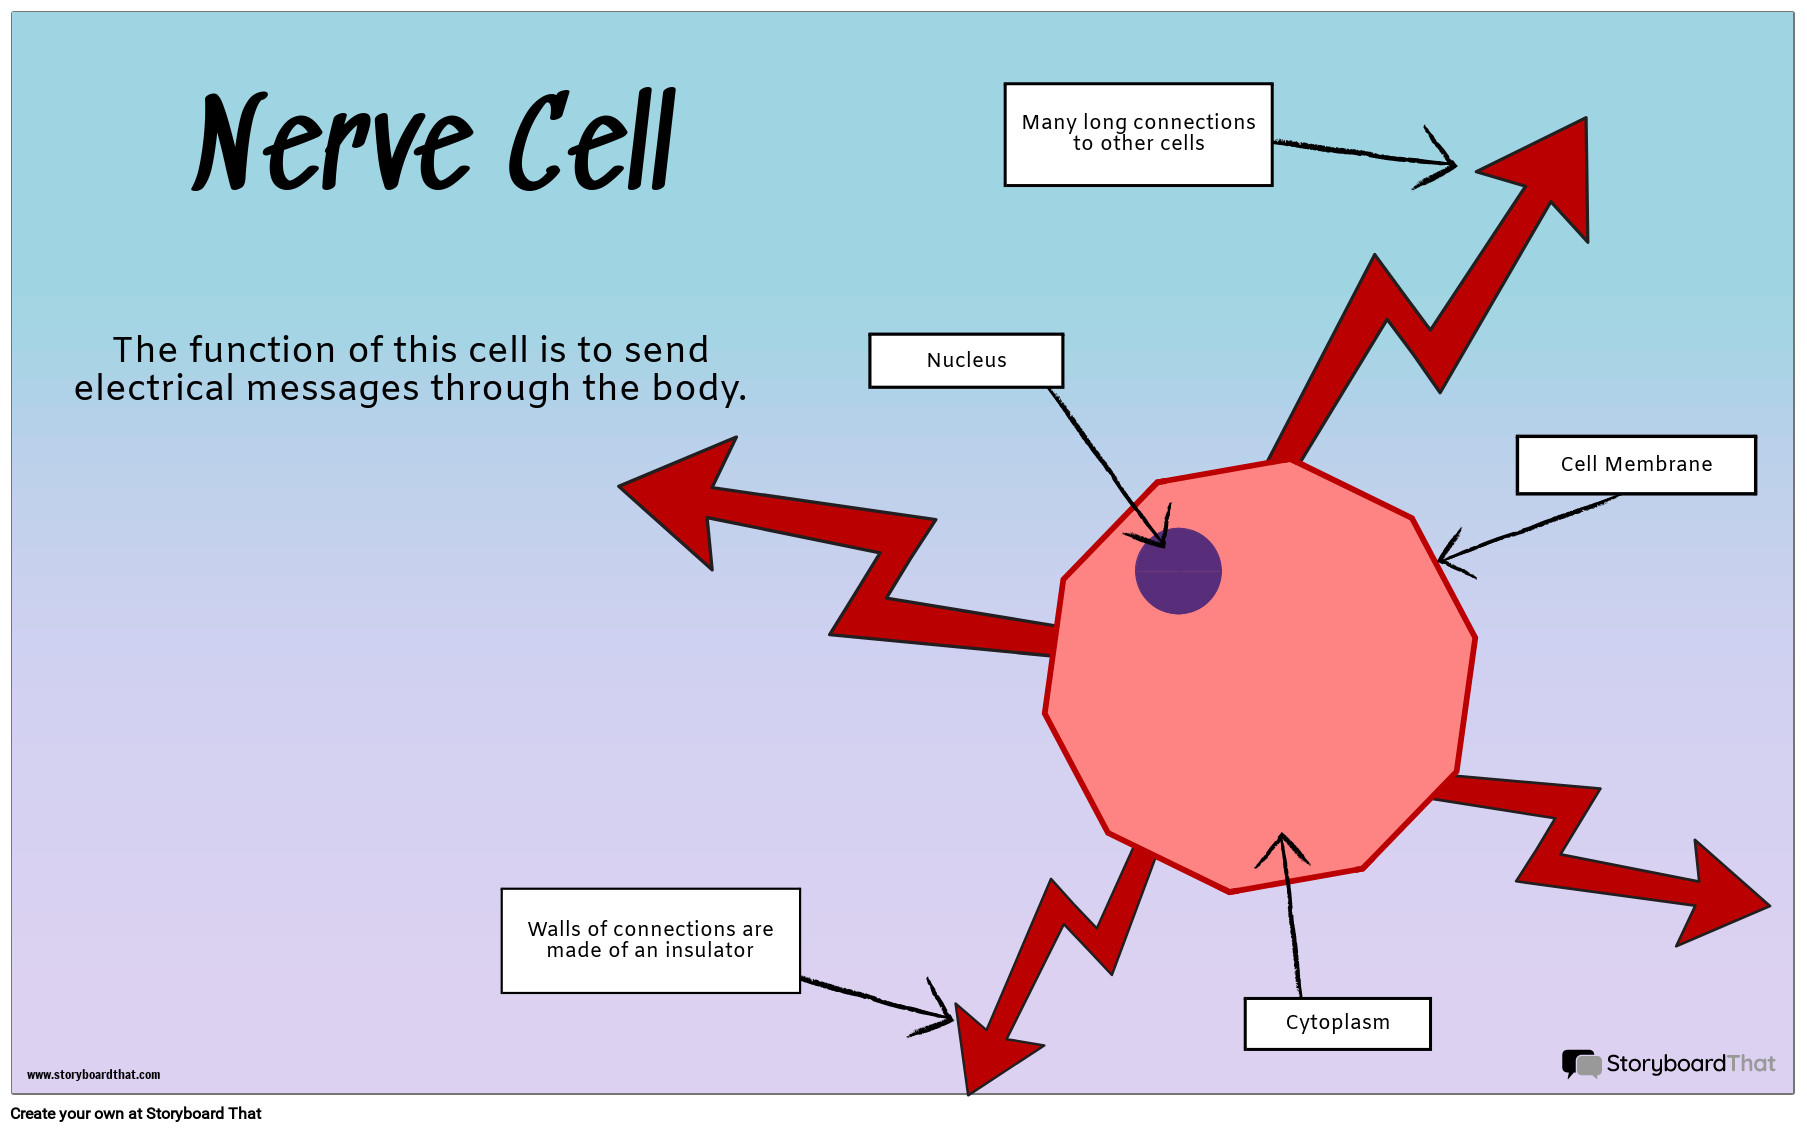
- Specialized Cells
- Basic Cells: Plant and Animal Cells
- The Carbon Cycle
- States of Matter
- The Digestive System
- Understanding Atomic Structures
- Renewable Energy
When finished, students' science posters can be printed, laminated, and hung around the classroom or school. Students can also project them onto the board and present their findings to their classmates, adding a public speaking component to the project. Teachers may wish to organize a "gallery walk" where students have the opportunity to walk around as if they are at the Science Museum!
Teachers, don't forget, you can add as many templates to your assignments as you wish! For additional templates to add to this assignment, check out our Science Infographic Templates, Science Fair Poster templates, PSA Infographic Templates or our Entire Infographic Gallery!
Istruzioni Modello e di Classe
(Queste istruzioni sono completamente personalizzabili. Dopo aver fatto clic su "Copia attività", aggiorna le istruzioni nella scheda Modifica del compito.)
Due Date:
Objective: Create an infographic to display your understanding of a topic
Student Instructions:
- Using your research, add important facts and details to the infographic template.
- Change fonts, colors, or styles how you wish.
- Add imagery to enhance your poster.
- Be sure to include at least 10 important facts to demonstrate what you have learned from your research.
- Save and exit when you're finished.
Piano Delle Lezioni di Riferimento
Rubrica
(Puoi anche crearne uno tuo su Quick Rubric.)
| Competente | Emergenti | Inizio | |
|---|---|---|---|
| Visualizzazione | Lo storyboard illustra chiaramente una cella che si adatta perfettamente alla funzione specificata. | Lo storyboard illustra una cella che si adatta perfettamente alla funzione specificata, ma è difficile da capire. | La cella storyboard non illustra chiaramente una cella che si adatta bene alla funzione specificata. |
| Identificazione di Componenti | Il diagramma della cella è chiaramente etichettato mostrando come è adatto alla sua funzione. | Il diagramma della cella è etichettato. | Il diagramma della cella non è etichettato. |
| Prova Dello Sforzo | Il lavoro è ben scritto e attentamente pensato. | Il lavoro mostra alcune prove di sforzo. | Il lavoro mostra poche prove di ogni sforzo. |
Più Storyboard That Attività
Progetti per le Scuole Superiori


Prezzi per Scuole e Distretti
© 2024 - Clever Prototypes, LLC - Tutti i diritti riservati.
StoryboardThat è un marchio di Clever Prototypes , LLC e registrato presso l'ufficio brevetti e marchi degli Stati Uniti


