Vertebrate Examples

You can find this storyboard in the following articles and resources:

Classification and Taxonomic Rank
By Oliver Smith
Scientists have discovered over a million different species of living things on Earth, but they estimate there could be as many as nine million in total. Scientists have devised a way of classifying these organisms, not only to organize them, but also to highlight similarities and differences. Learn more at Storyboard That!

Chart Layout
by Lauren Ayube
A chart is a graphic organizer that simplifies and organizes multiple aspects of data that is associated with multiple topics or items. Charts are used to visually represent information to show the relationship between ideas.
'
Storyboard Description
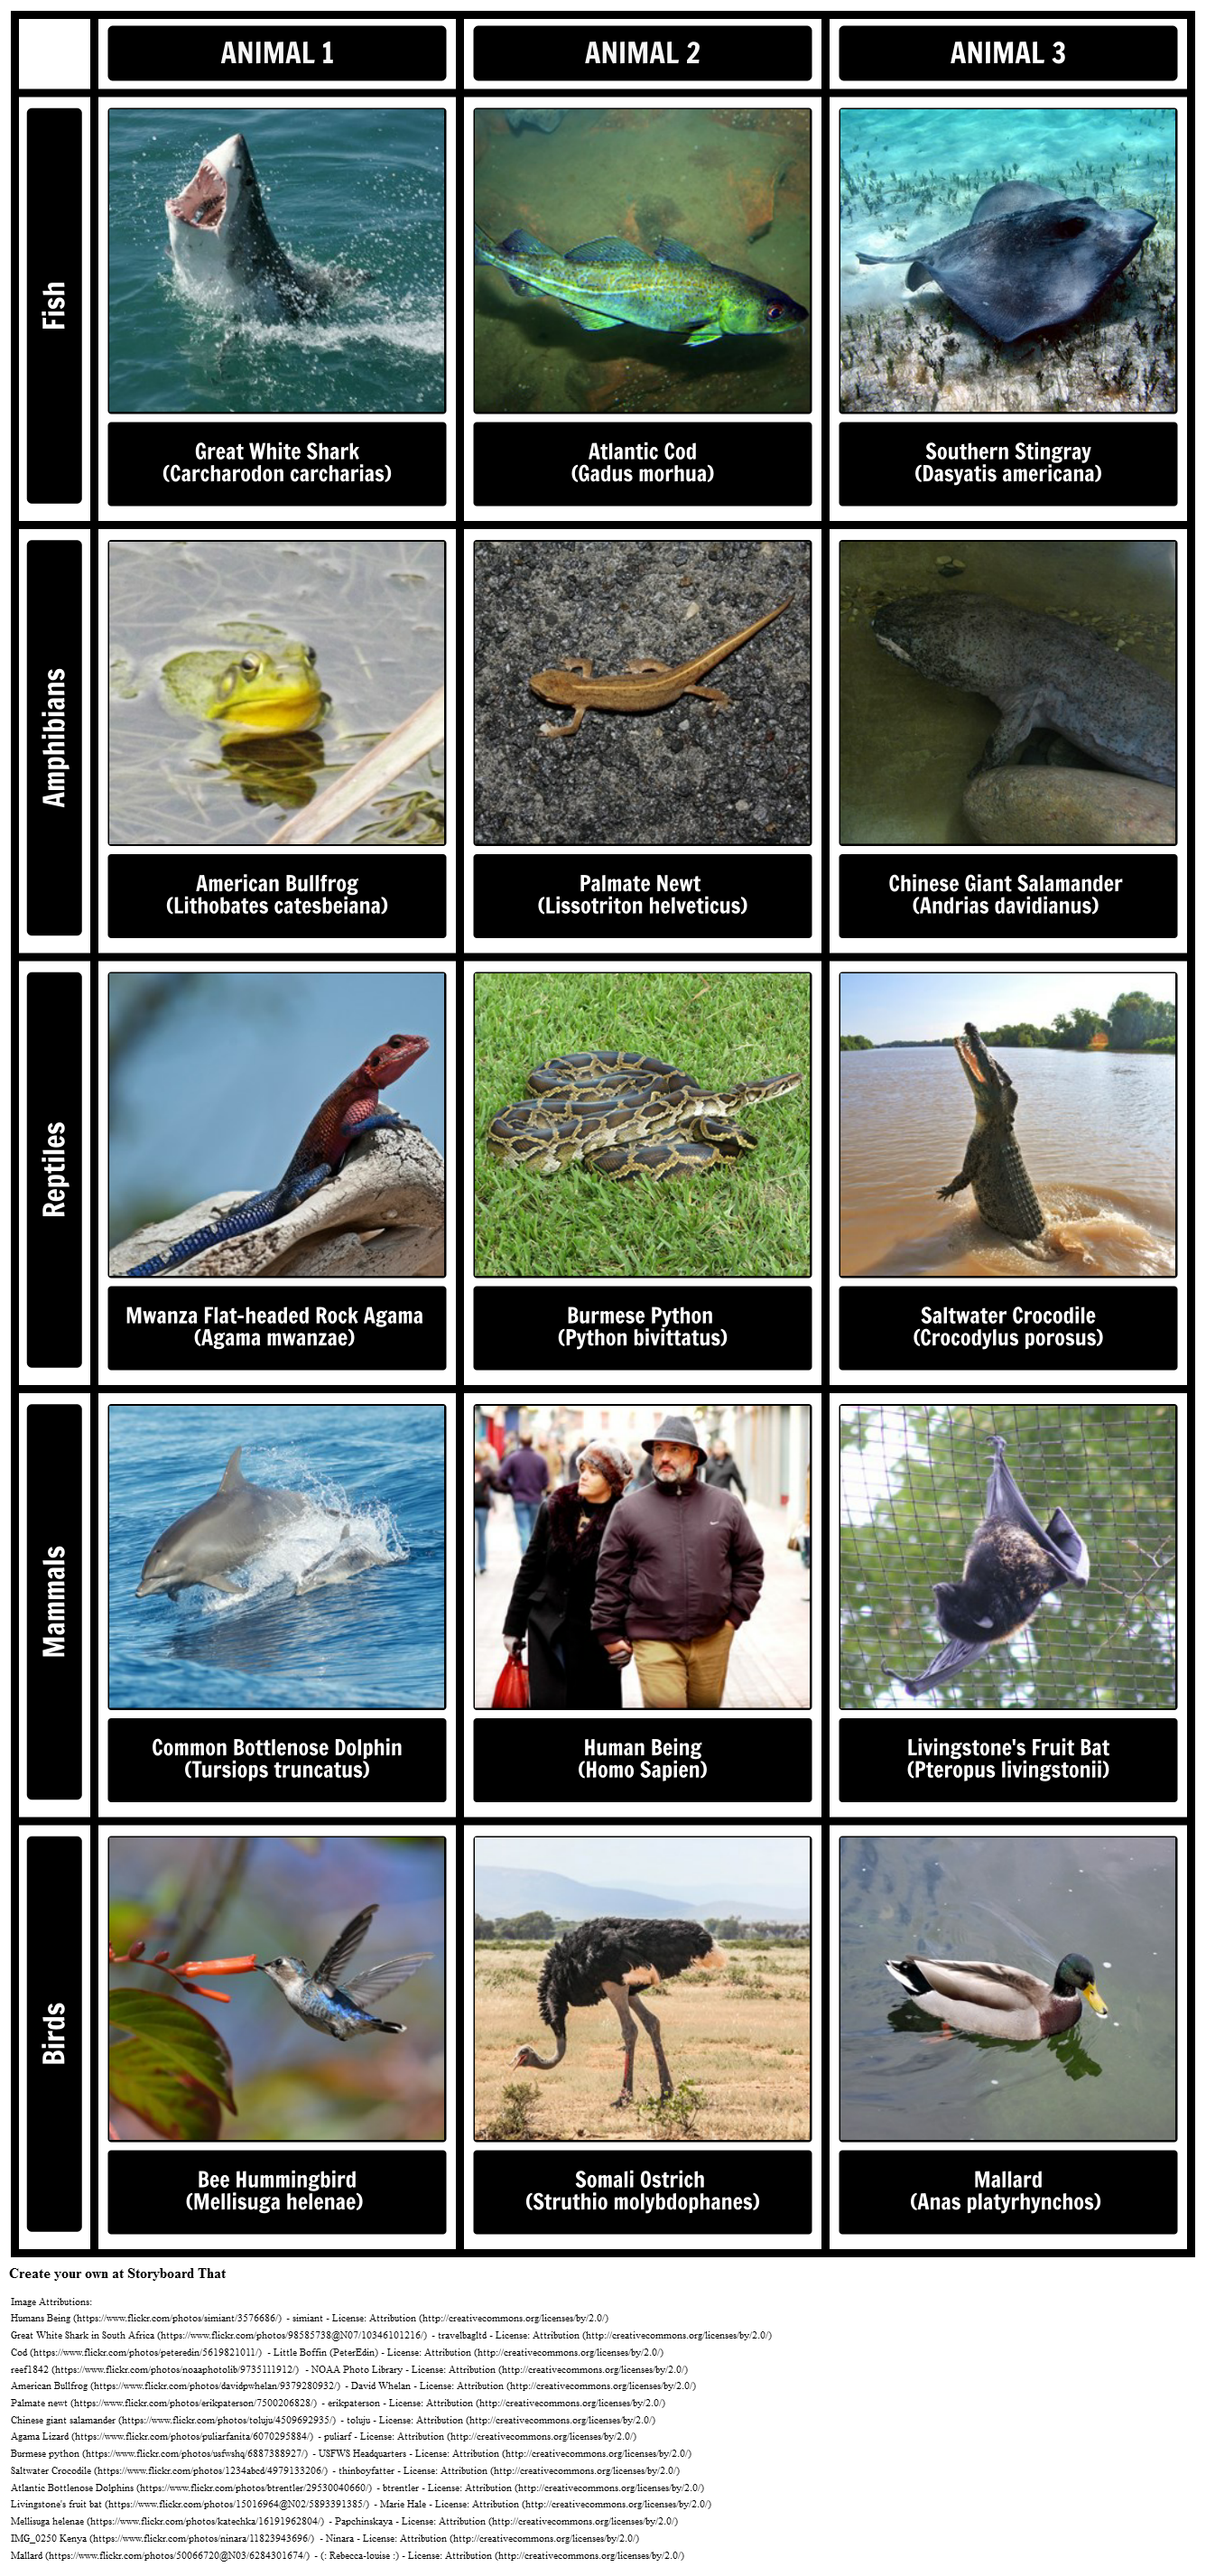
Vertebrate Examples
Storyboard Text
- Fish
- ANIMAL 1
- ANIMAL 2
- ANIMAL 3
- Great White Shark (Carcharodon carcharias)
- Atlantic Cod (Gadus morhua)
- Southern Stingray (Dasyatis americana)
- Amphibians
- American Bullfrog (Lithobates catesbeiana)
- Palmate Newt (Lissotriton helveticus)
- Chinese Giant Salamander (Andrias davidianus)
- Reptiles
- Mwanza Flat-headed Rock Agama (Agama mwanzae)
- Burmese Python (Python bivittatus)
- Saltwater Crocodile (Crocodylus porosus)
- Mammals
- Common Bottlenose Dolphin (Tursiops truncatus)
- Human Being (Homo Sapien)
- Livingstone's Fruit Bat (Pteropus livingstonii)
- Birds
- Bee Hummingbird (Mellisuga helenae)
- Somali Ostrich (Struthio molybdophanes)
- Mallard (Anas platyrhynchos)
Image Attributions
- Agama Lizard - puliarf - (License Attribution )
- American Bullfrog - David Whelan - (License Attribution )
- Atlantic Bottlenose Dolphins - btrentler - (License Attribution )
- Burmese python - USFWS Headquarters - (License Attribution )
- Chinese giant salamander - toluju - (License Attribution )
- Cod - Little Boffin (PeterEdin) - (License Attribution )
- Great White Shark in South Africa - travelbagltd - (License Attribution )
- Humans Being - simiant - (License Attribution )
- IMG_0250 Kenya - Ninara - (License Attribution )
- Livingstone's fruit bat - Marie Hale - (License Attribution )
- Mallard - (: Rebecca-louise :) - (License Attribution )
- Mellisuga helenae - Papchinskaya - (License Attribution )
- Palmate newt - erikpaterson - (License Attribution )
- reef1842 - NOAA Photo Library - (License Attribution )
- Saltwater Crocodile - thinboyfatter - (License Attribution )
Over 30 Million Storyboards Created


