What is the Chart Layout?
A chart is a graphic organizer that simplifies and organizes multiple aspects of data that is associated with multiple topics or items. Charts are used to visually represent information to show the relationship between ideas. Charts can be used for a number of different reasons such as comparing and contrasting, showing attributes, and evaluating information.
Chart Layouts Help You:
- Organize information
- Create a visual representation a variety of attributes.
- Separate information into similar groups
Breaking Down the Chart Layout
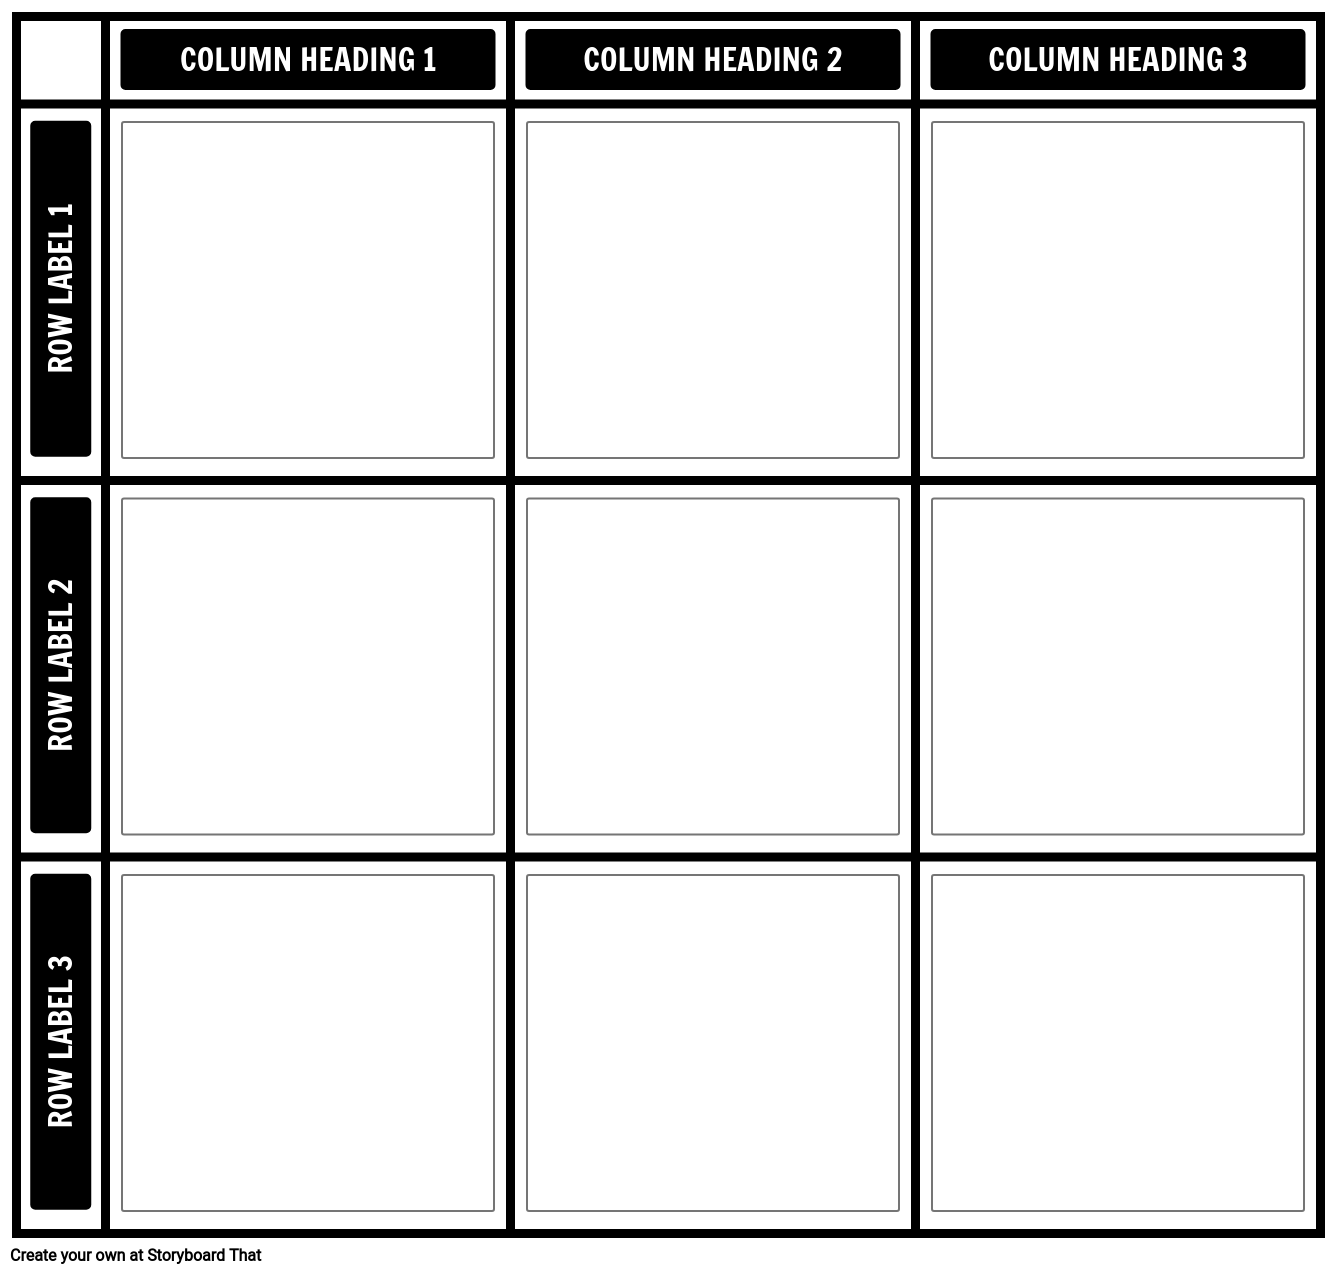
The chart is an effective and easy to use graphic organizer because of its simple and straightforward layout. Charts can have up to ten rows and ten columns, in any configuration the user would like depending on their needs. Each column has a header at the top, which describes the information that is vertically represented. Each row also has a header, located at the left, which represents the information that is horizontally represented.
Using Charts in the Classroom
Charts can be used across all subject areas, and are a very easy way for students to keep track of information in a visual manner
Social Studies and History
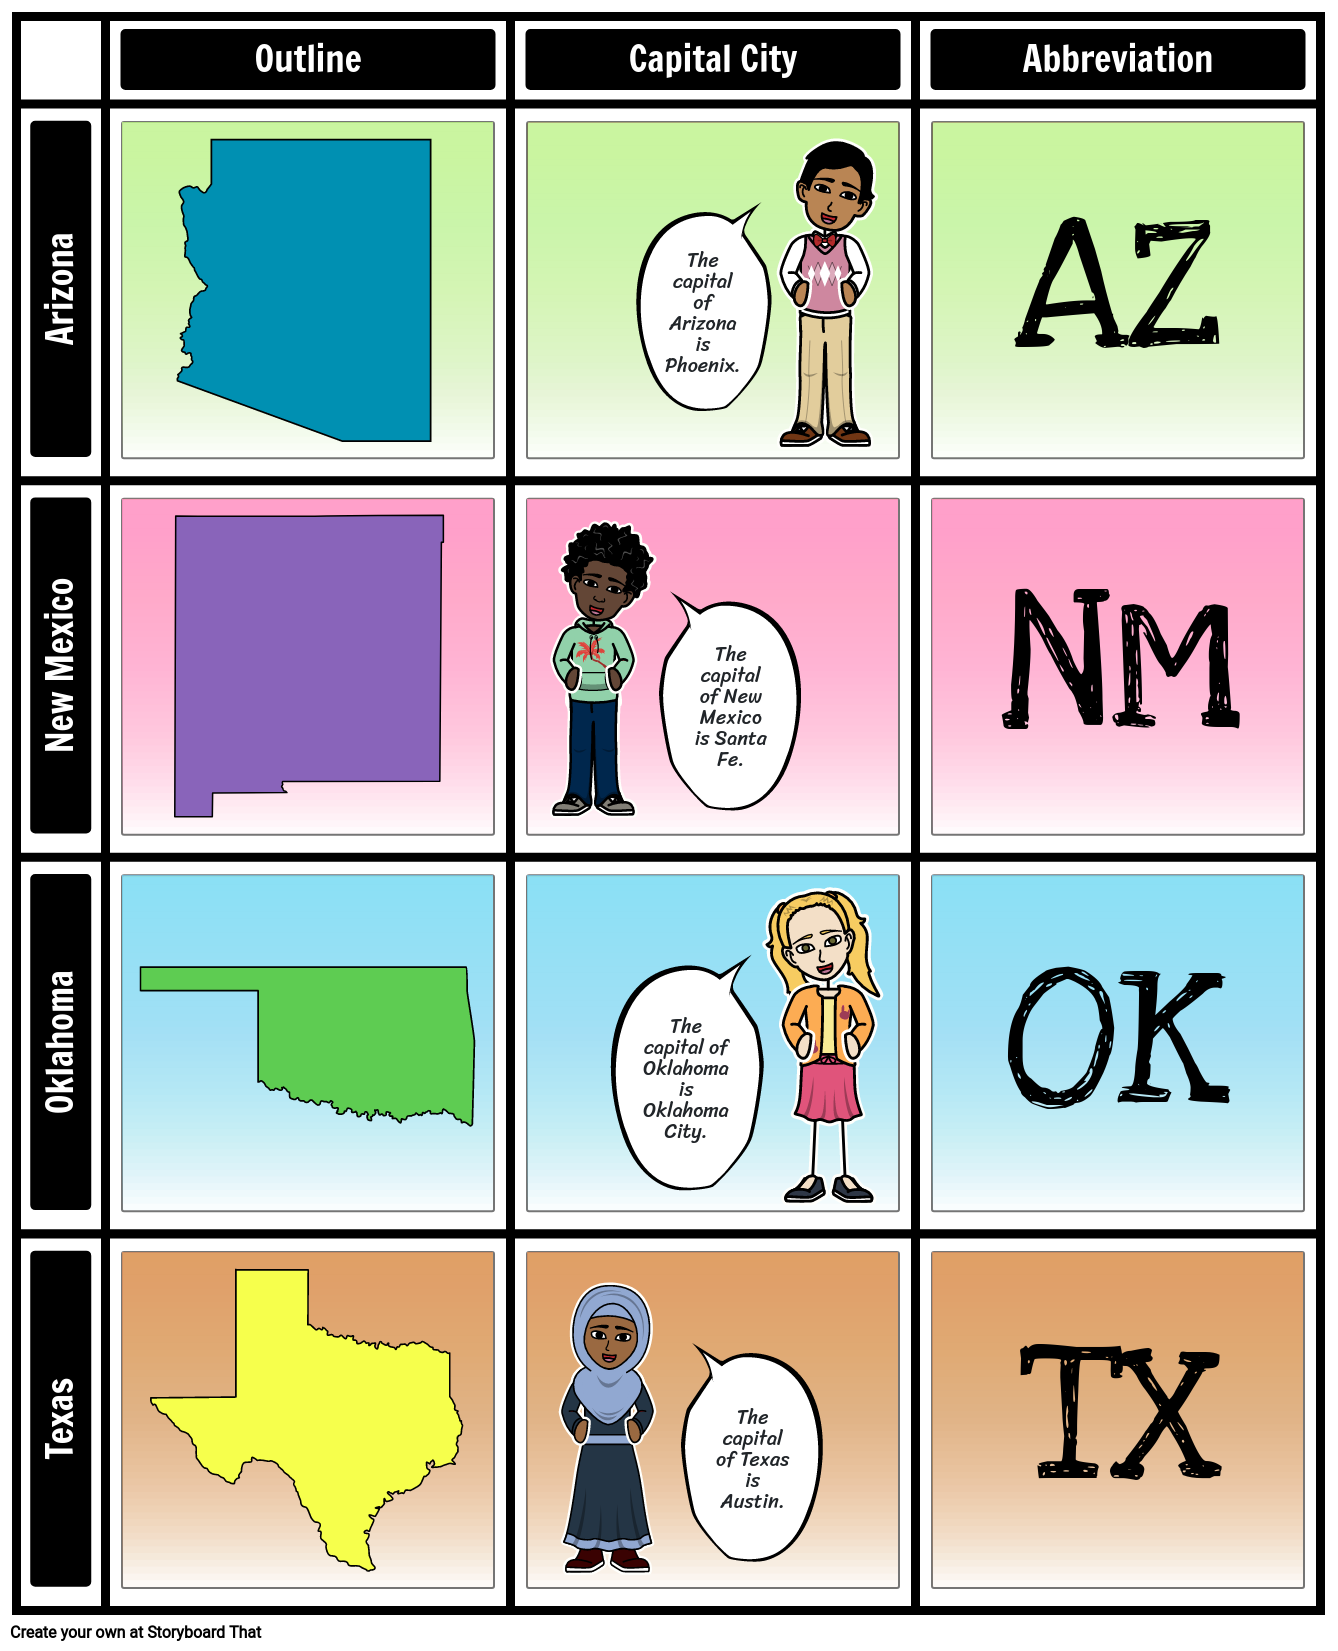
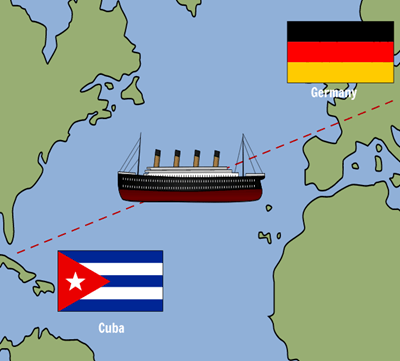
When learning geography, students often have to memorize states, capitals, countries, and more. In a history class, students may need to differentiate between different countries and their government, economy, etc. A chart is an excellent way to keep all of this information right in front of students as a reference, and is something they can fill in themselves.
Science
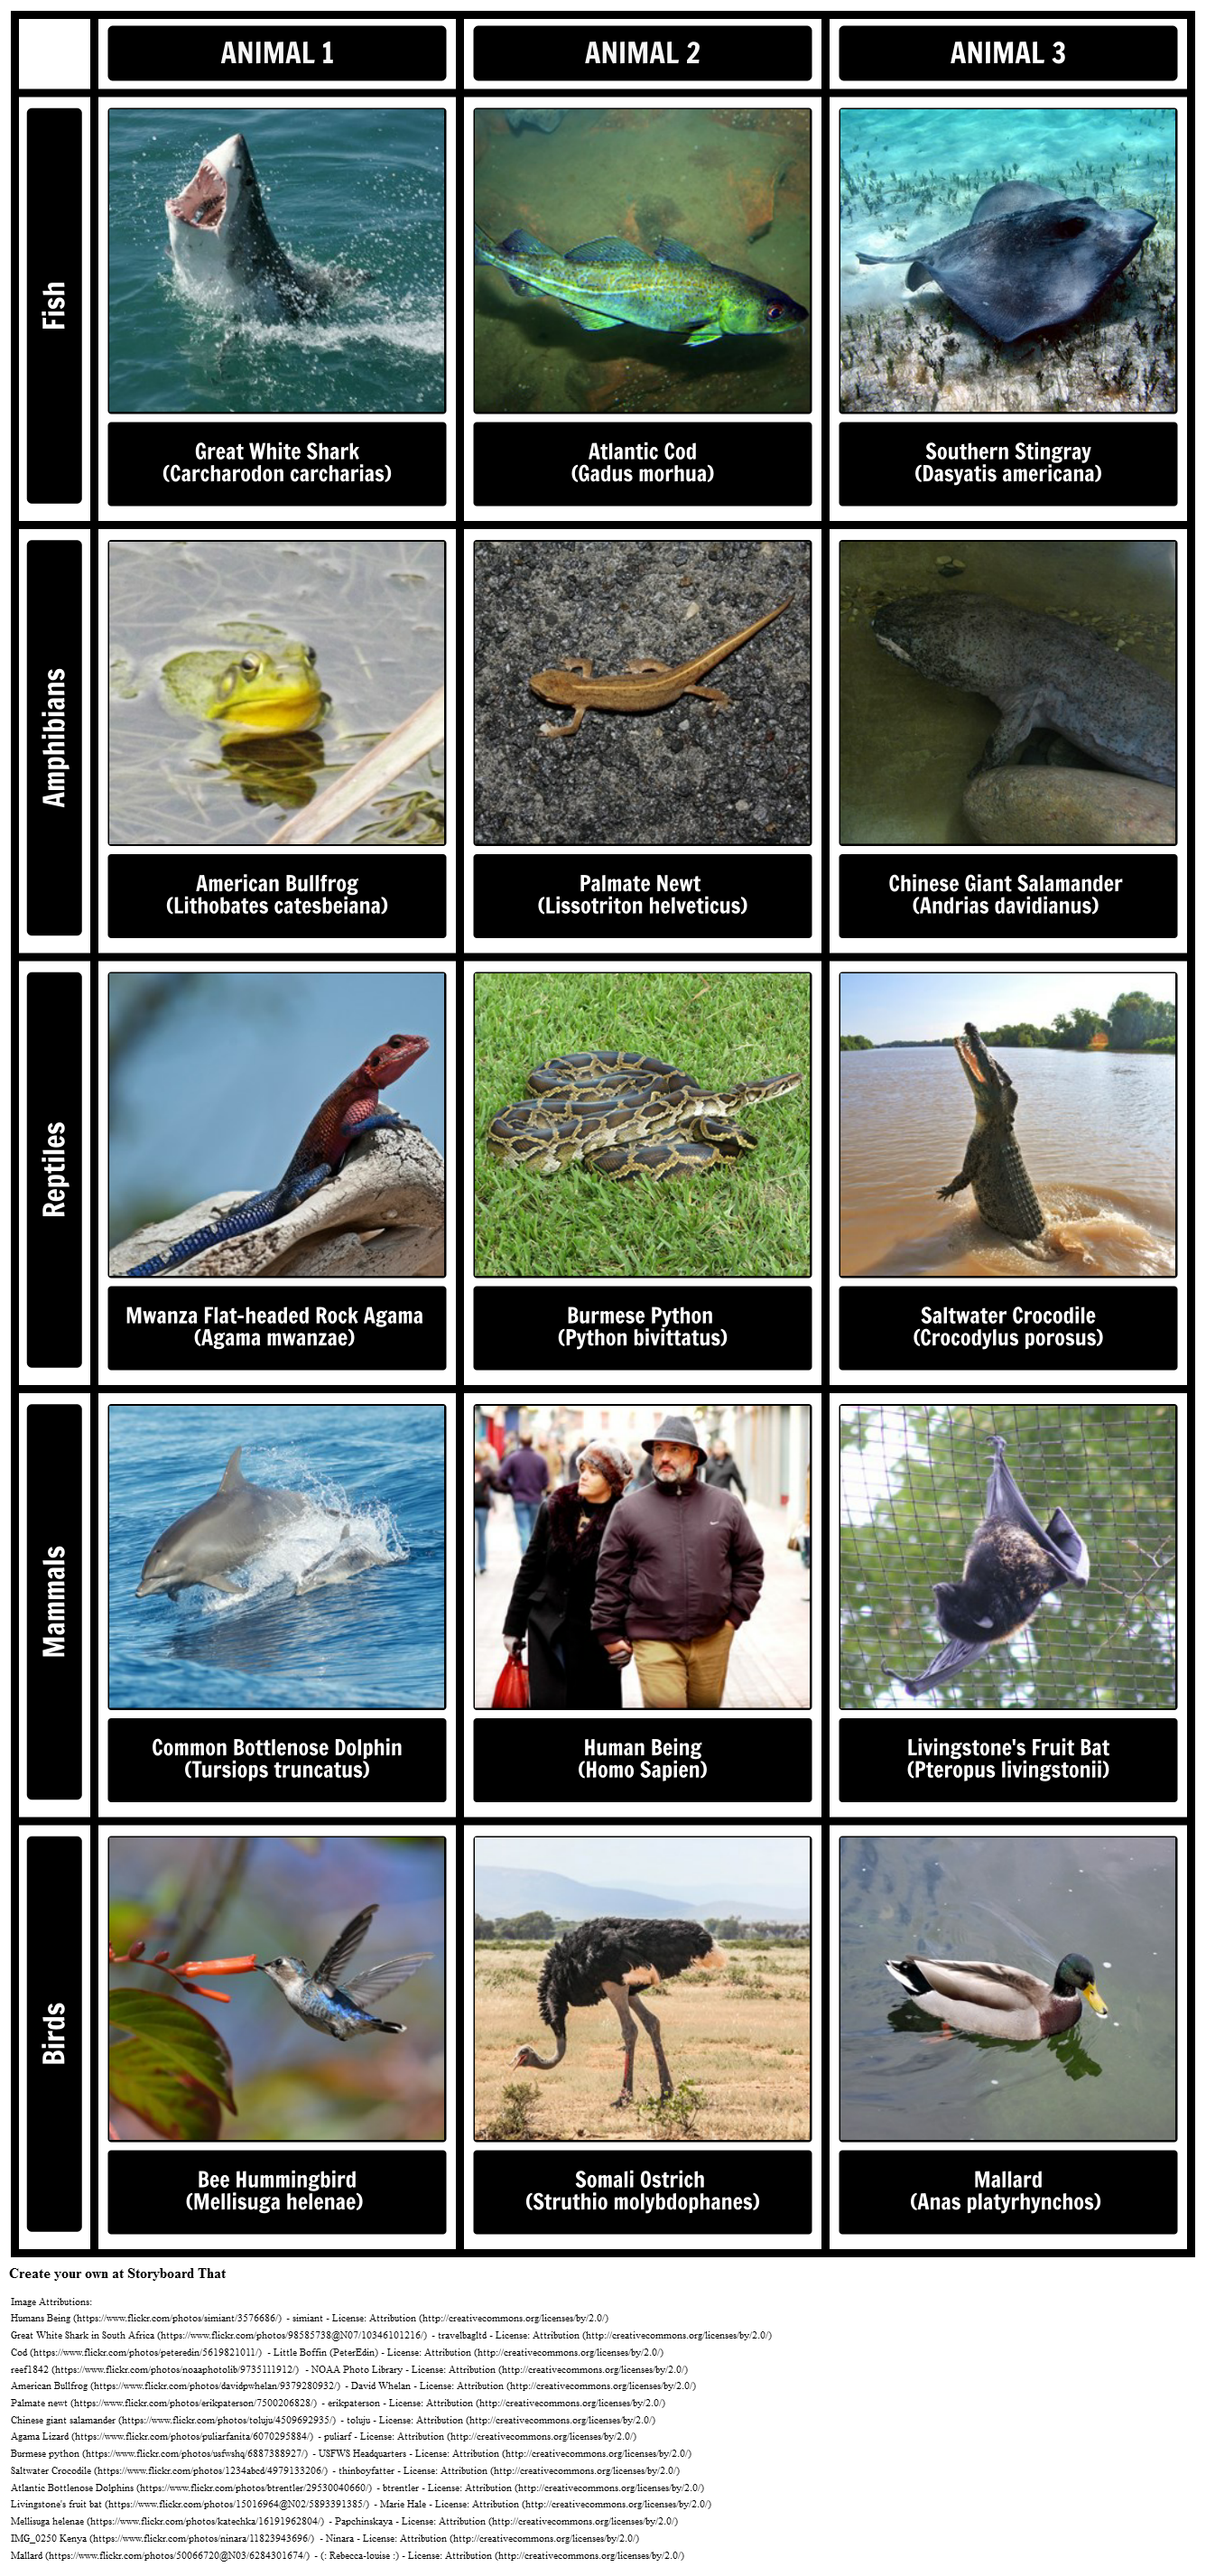
One way to use a chart in a life science class is when students have to organize animals into groups. For example, they may organize mammals, reptiles, and fish; carnivores, herbivores, and omnivores; or even types of vertebrates or invertebrates. Charts can also be used in chemistry, physics, astronomy, and even biology.
ELA
A character chart is the perfect addition to any novel study, and is a perfect example of how to use the chart layout in reading. Having all of the characters visually represented and organized will help students to better understand character growth and change over the course of the book.
Foreign Language
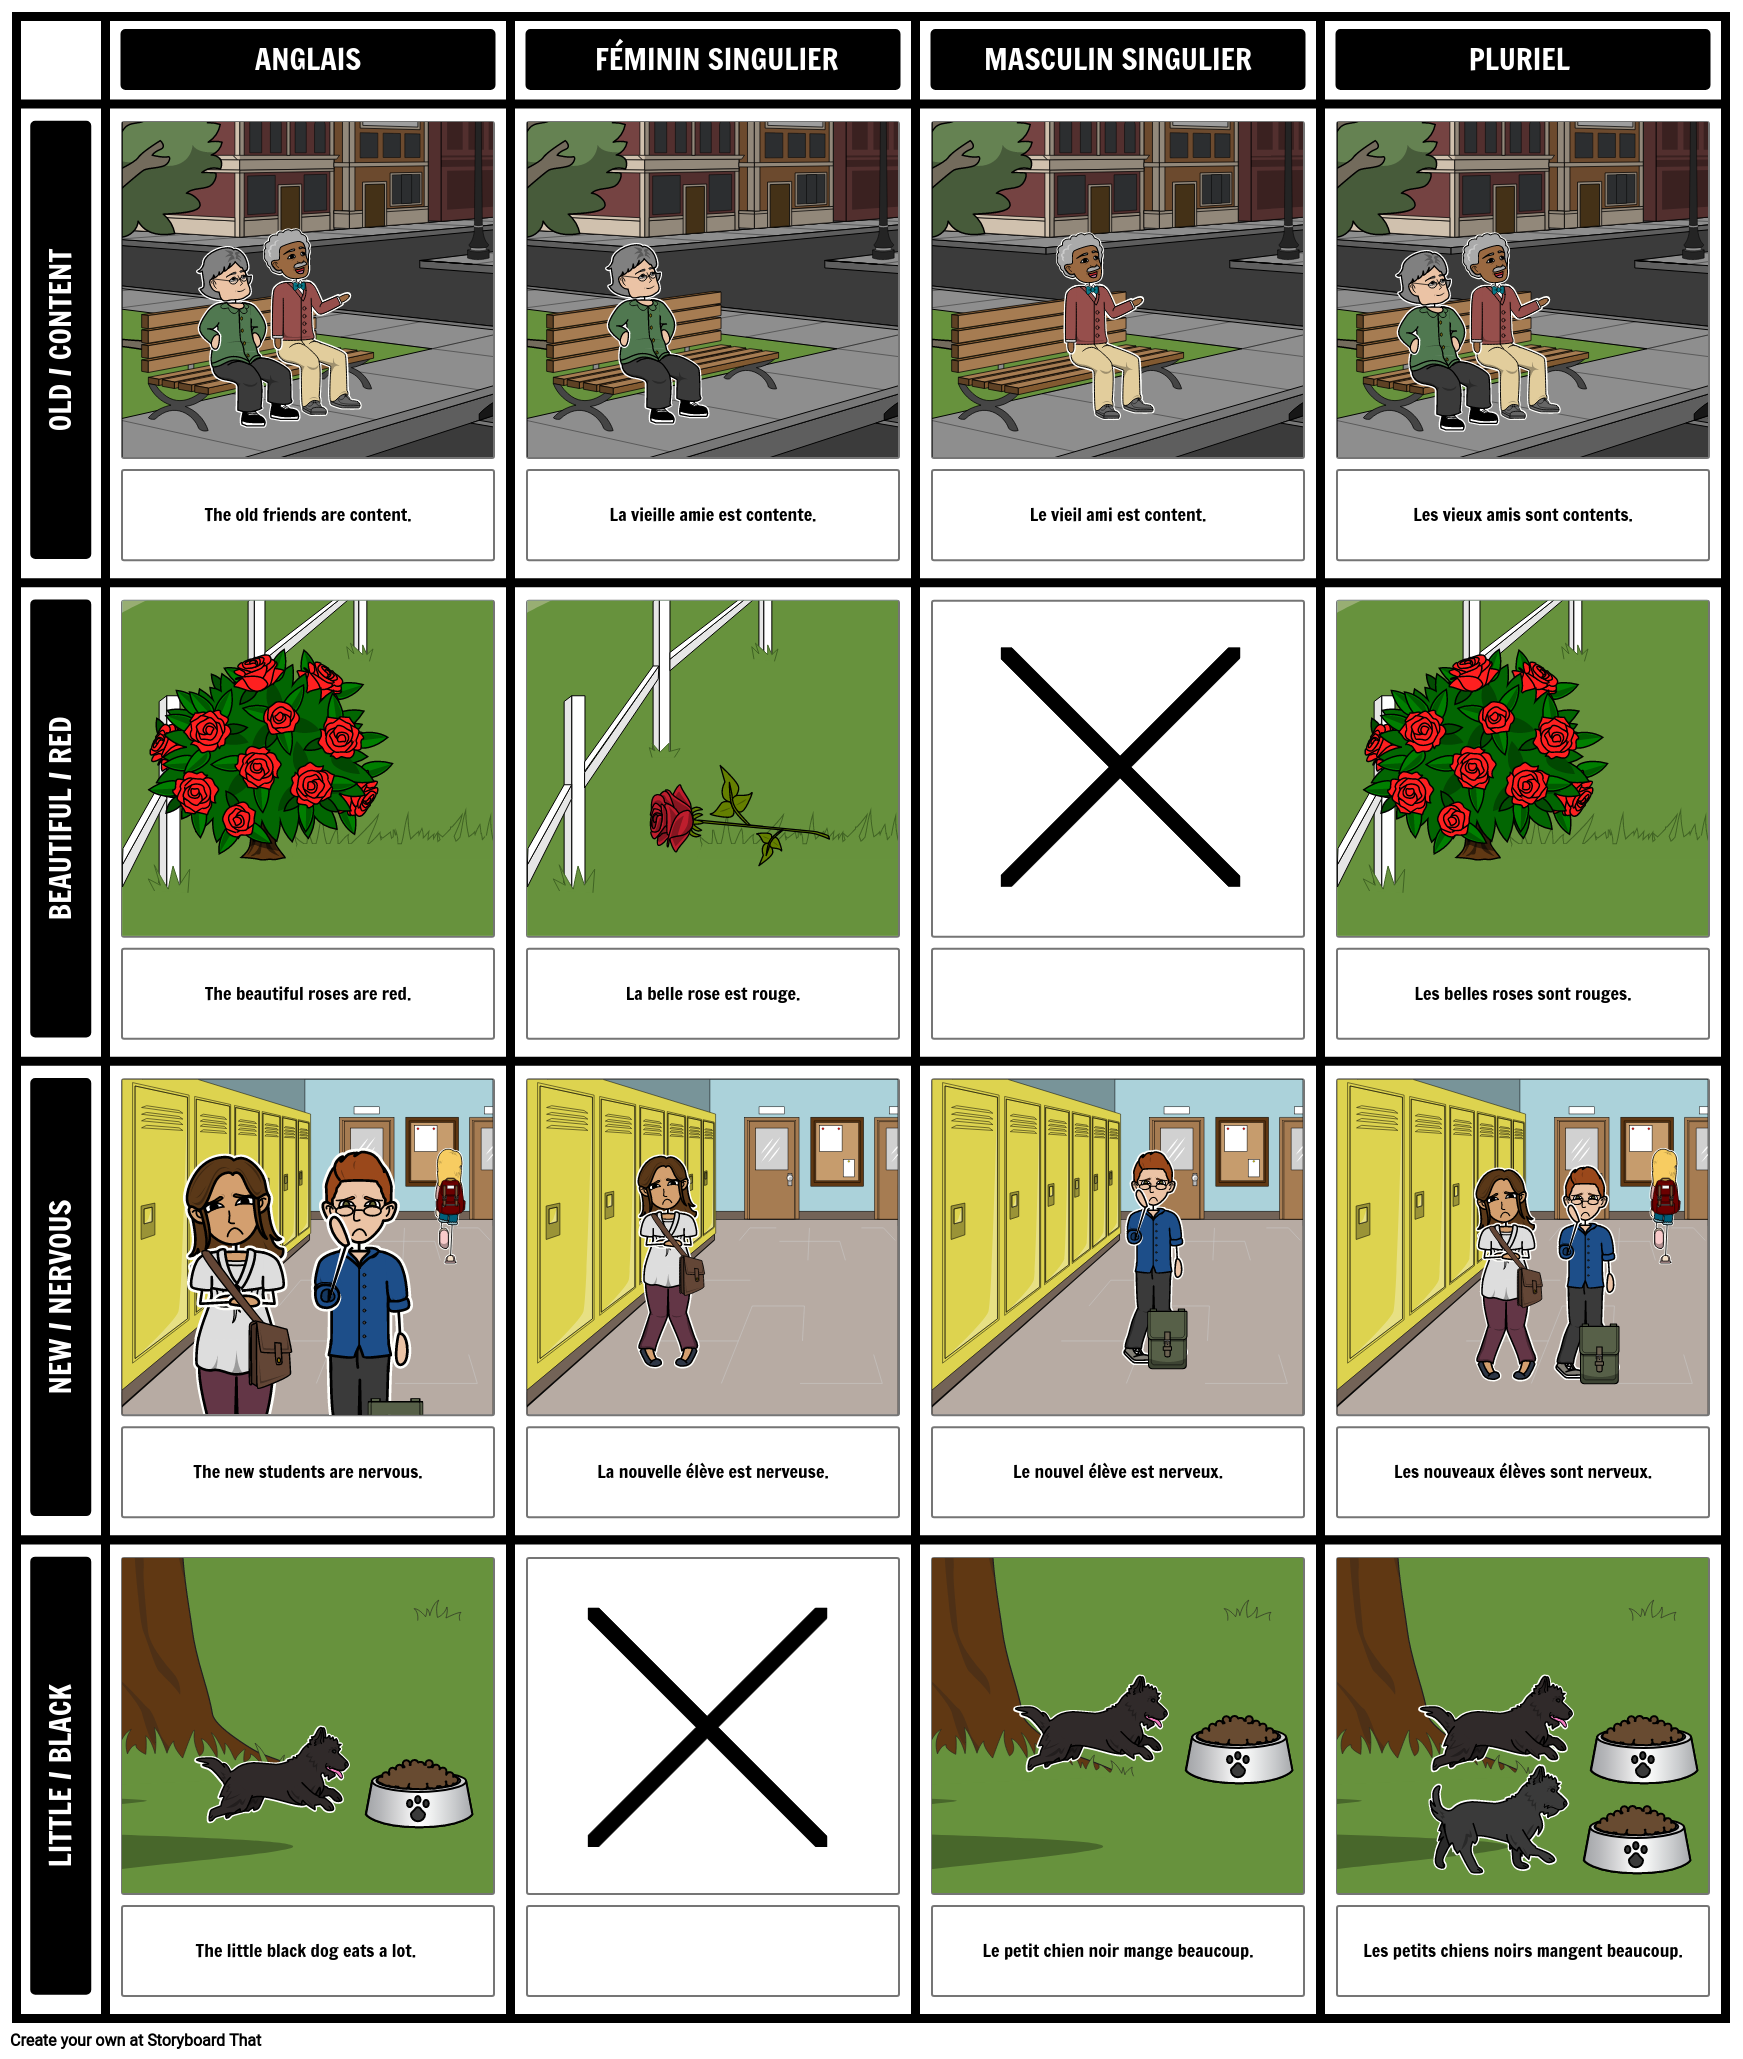
As students begin studying a foreign language, visuals provide helpful reinforcement for grammatical concepts and new vocabulary. One way that a chart could be used in language class is to organize a variety of adjectives in their different forms such as feminine, masculine, and plural.
Math
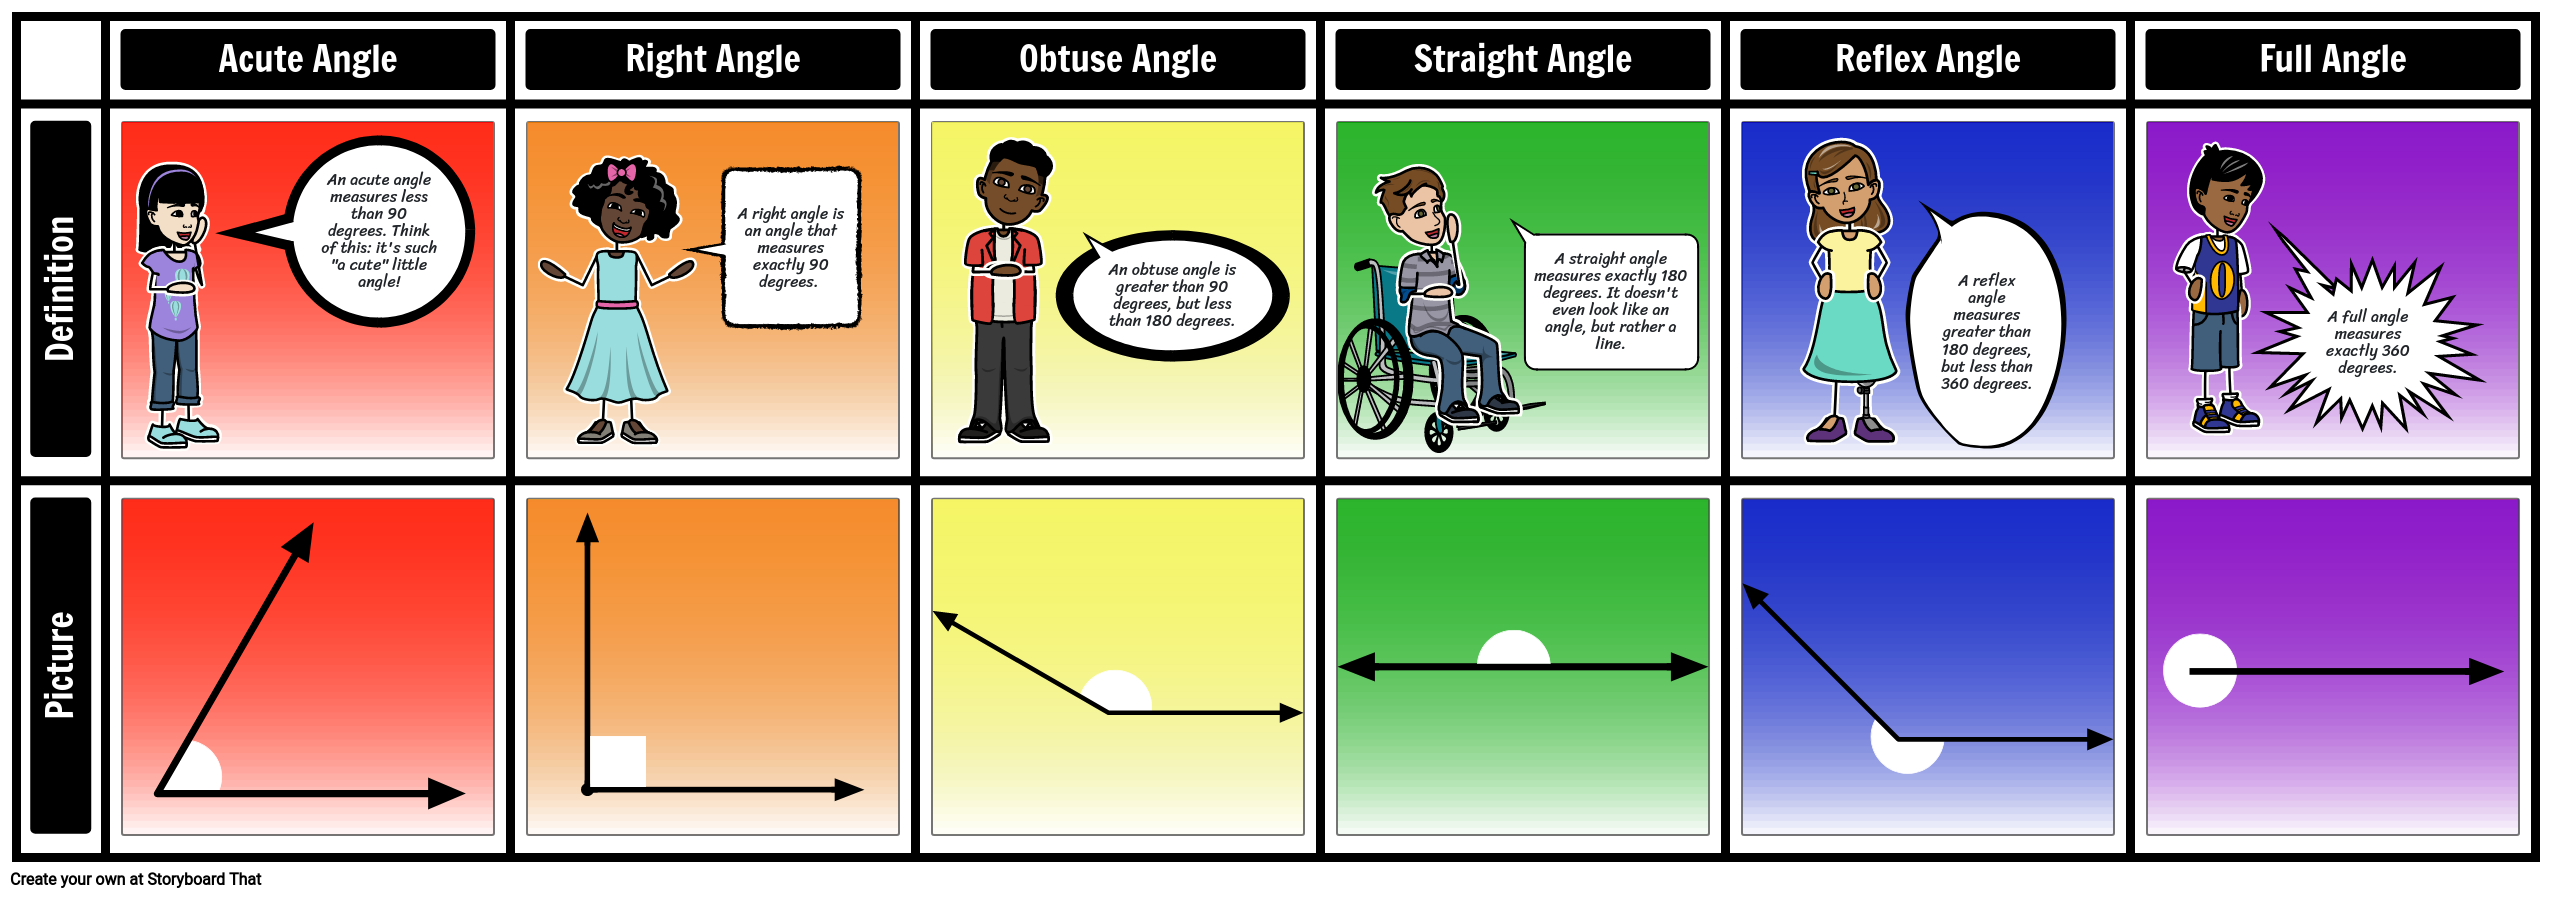
Charts are frequently used in mathematics to show relationships between numbers. Perhaps the most common chart used in math is the multiplication chart. Other ways to use a chart in math include showing the different types of angles, geometric solids, or types of fractions.
Applications for Special Education
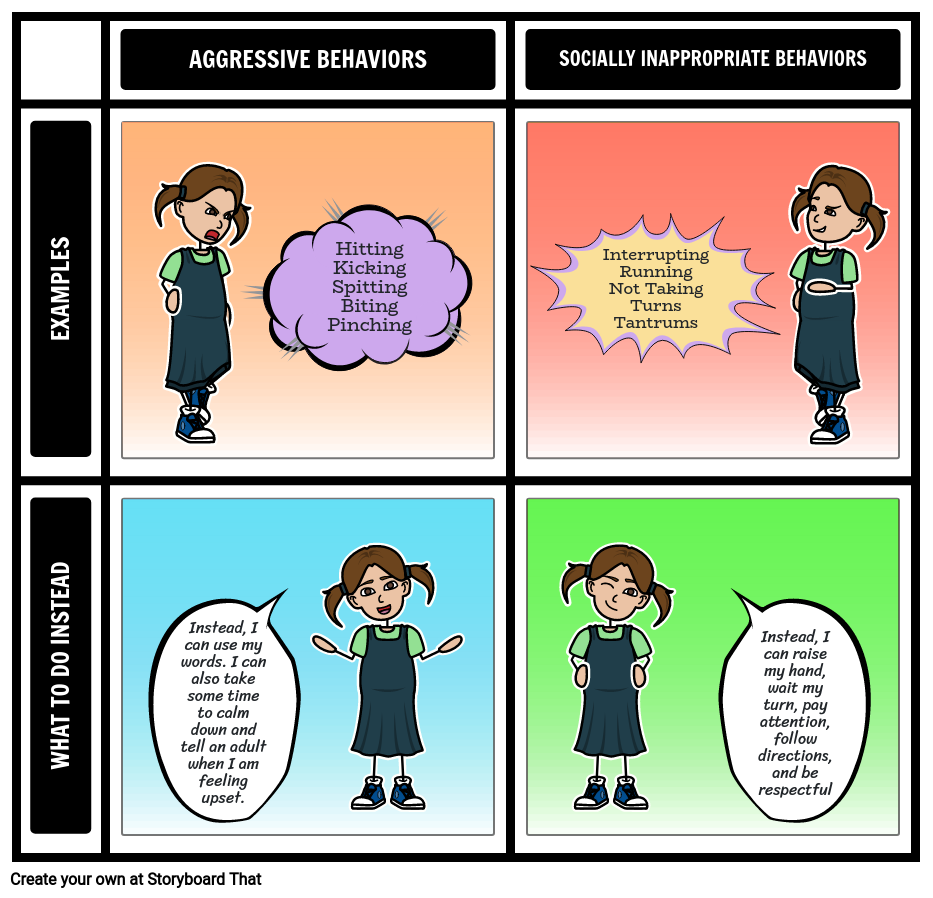
Storyboard That is a fun tool for everyone in the classroom, but may be particularly useful for students on IEPs and 504 plans. Graphic organizers serve as a way to structure or guide a student's thinking. The chart layout is perfect for this, as it displays all kinds of related information in a very organized and predictable way. In addition, charts can be used to illustrate expected classroom behaviors, rules, schedules, and so much more!
Students and teachers can incorporate pictures, colors, and text into their graphic organizers. For students who struggle with fine motor skills, the ability to show their thinking digitally allows handwriting and drawing ability to become irrelevant. They don't need to stress about extra elements of an assignment. All students end up with a graphic organizer they can look back on later, and will be something they can still understand.
Here are a few additional ideas on when to use a cycle layout storyboard for special education:
- Keep track of multiple characters’ journeys in a story
- Create visual vocabulary boards
- Use Storyboard That instead of a pencil and paper assignment
- Create boards for games, rewards, and communication needs
- Keep track of different routines throughout the day
Related Activities
How to Design Effective Charts for Data Visualization
Step 1: Determine the Purpose and Audience
Clarify the purpose of the chart: What message or insight do you want to convey? Consider the target audience: What level of detail and complexity is appropriate for them?
Step 2: Choose the Right Chart Type
Select a chart type that best represents the data and supports the intended message. Consider options such as bar charts, line graphs, pie charts, scatter plots, or stacked area charts.
Step 3: Organize and Simplify the Data
Ensure the data is clean, relevant, and organized in a logical manner. Remove unnecessary information and focus on the key data points or categories.
Step 4: Design Clear and Informative Labels
Provide clear and concise labels for the chart's axes, titles, legends, and data points. Use descriptive and meaningful labels to help viewers understand the data at a glance.
Step 5: Utilize Color and Visual Elements Strategically
Use color to highlight important data points, create visual hierarchy, or differentiate categories. Be mindful of color choices and ensure accessibility by considering colorblindness and contrast.
Step 6: Simplify and Balance the Chart Layout
Keep the chart design clean and uncluttered, avoiding excessive visual elements. Ensure a balanced composition by spacing elements appropriately and utilizing white space effectively.
Frequently Asked Questions About Using the Chart Layout with Students
Why is chart layout important for students?
Chart layout is important for students because it presents information in a clear and organized way that helps them process and understand the material. It also helps students to remember and recall the information more easily.
How can teachers incorporate chart layout into their lessons?
Teachers can incorporate chart layout into their lessons by using visual aids to present information, such as creating charts and graphs to illustrate data or drawing diagrams to show relationships between concepts. Teachers can also encourage students to create their own charts and graphs to help them better understand the material.
How can students benefit from creating their own charts and graphs?
When students create their own charts and graphs, they are actively engaging with the material and organizing the information in a way that makes sense to them. This can help them to better understand and remember the material. Additionally, creating their own charts and graphs can be a fun and creative way for students to demonstrate their learning.
- 26177 • Clker-Free-Vector-Images • License Free for Most Commercial Use / No Attribution Required / See https://pixabay.com/service/license/ for what is not allowed
- 5228066 • clarencealford • License Free for Most Commercial Use / No Attribution Required / See https://pixabay.com/service/license/ for what is not allowed
- Agama Lizard • puliarf • License Attribution (http://creativecommons.org/licenses/by/2.0/)
- American Bullfrog • David Whelan • License Attribution (http://creativecommons.org/licenses/by/2.0/)
- Atlantic Bottlenose Dolphins • btrentler • License Attribution (http://creativecommons.org/licenses/by/2.0/)
- Burmese python • USFWS Headquarters • License Attribution (http://creativecommons.org/licenses/by/2.0/)
- Chinese giant salamander • toluju • License Attribution (http://creativecommons.org/licenses/by/2.0/)
- Cod • Little Boffin (PeterEdin) • License Attribution (http://creativecommons.org/licenses/by/2.0/)
- Great White Shark in South Africa • travelbagltd • License Attribution (http://creativecommons.org/licenses/by/2.0/)
- Humans Being • simiant • License Attribution (http://creativecommons.org/licenses/by/2.0/)
- IMG_0250 Kenya • Ninara • License Attribution (http://creativecommons.org/licenses/by/2.0/)
- Livingstone's fruit bat • Marie Hale • License Attribution (http://creativecommons.org/licenses/by/2.0/)
- Mallard • (: Rebecca-louise :) • License Attribution (http://creativecommons.org/licenses/by/2.0/)
- Mellisuga helenae • Papchinskaya • License Attribution (http://creativecommons.org/licenses/by/2.0/)
- Palmate newt • erikpaterson • License Attribution (http://creativecommons.org/licenses/by/2.0/)
- reef1842 • NOAA Photo Library • License Attribution (http://creativecommons.org/licenses/by/2.0/)
- Saltwater Crocodile • thinboyfatter • License Attribution (http://creativecommons.org/licenses/by/2.0/)
Introductory School Offer
ONLY$500
- 1 School
- 5 Teachers for One Year
- 1 Hour of Virtual PD
30 Day Money Back Guarantee • New Customers Only • Full Price After Introductory Offer • Access is for 1 Calendar Year
© 2025 - Clever Prototypes, LLC - All rights reserved.
StoryboardThat is a trademark of Clever Prototypes, LLC, and Registered in U.S. Patent and Trademark Office
