65% of the world's population are visual learners.
What does that mean for your classroom? Visual projects, posters, and infographics will go a long way in helping your students understand the material and enjoy learning as they go! It's become essential to include visual aids in lessons.
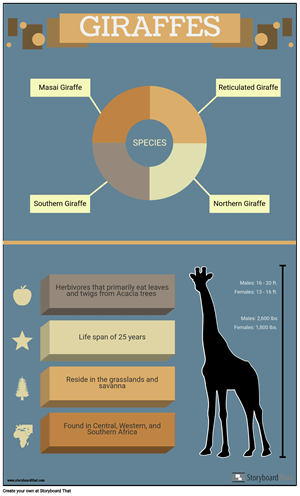
But what are infographics, you ask? Infographics are images that contain important or key information on a topic, such as statistics or quick facts. They are easily digestible, visual, and a great asset in any classroom. They're a cousin to posters, although they can be created to be much smaller and spread digitally.
Using infographics in the classroom is extremely valuable. They're versatile enough to be used in several different ways, and are visual enough to make important information stand out. Here are three ways students can benefit from infographics.
1. Introduce a Unit
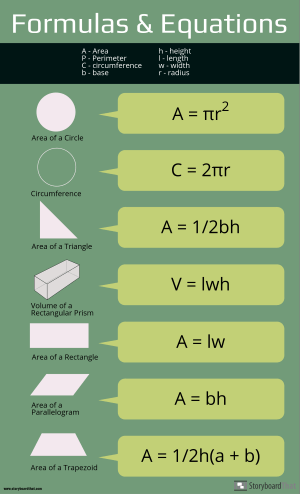
Sometimes before starting a new unit in math, a teacher might provide students with a card or sheet of paper that contains all the important formulas they will be learning and using during the next few weeks. Or, a savvy student will create their own and keep it as a reference sheet in their notebook or binder. But this practice doesn't just have to extend to math class!
Reference sheets, or "cheat sheets", give students a home base from which they'll be better prepared for the unit ahead. It's a preview for what is the most important information, but isn't totally comprehensive, so students still have to pay attention. Using infographics ensures that students start off on as equal footing as you can provide.
Example Infographics for Introducing a Unit:
- Timeline of events for your history unit
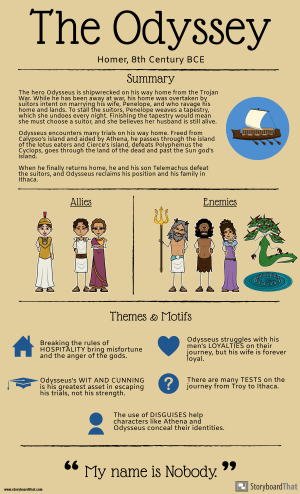
- Background information for a novel or short story
- Key terms and formulas for science
- Most common homophones
- Punctuation reference sheet
- Key figures for the unit
- Important mathematical formulas
- Verb conjugation endings
- Sentence structures
Once you've created your amazing infographics, you can include it in the beginning of your PowerPoint presentation, send it out to your students through Storyboard That (or your classroom management system), or print it and pass it out to students at the start of the class.
2. Summarize a Unit
Infographics can be created after a unit as well, to provide students with a summary of key information. Many of the examples listed above can also fit into this category as well. This will also help students prepare for final exams, since they'll have something to use as a starting point for studying. These takeaways won't include every detail, so students should still pay attention and take notes during the class.
A fun way to incorporate student feedback is to have them identify what they think is the most important information and create the infographic as a class. This provides you with the opportunity to see how well students understood the lesson or unit, and allows the students to take ownership of what they learned. Students can also create their own individually, which leads us to our next use of infographics in the classroom.
3. Distill and Visualize Information
This use is twofold; not only can infographics be used to bookend a lesson and allow students to determine the most important information they learned, but they can also be created as a larger research project!
When students are researching or even studying for final exams, there's so much information that it can be overwhelming. They might feel like they need to pour every statistic, fact, and bit of information into their projects or have a hard time figuring out what is the most important things to remember.
Creating an infographic helps students learn how to distill information and think critically about what they want their audience to take away from the image. What imagery should they use to convey the information? How clearly and concisely can they convey facts and figures? Many aspects of creating infographics, from integrating information to creating visual presentations, is part of the Common Core standards for a variety of subjects.
So How do I Start?
Storyboard That has plenty of art that was created specifically for infographics, but you don't have to feel limited by that category. Infographics are primarily visual, so you can use any and all of the art available in the Storyboard Creator! We also have infographic templates to help you get started. Our gallery is always growing, and templates can be added to assignments so students can create their own.
Related Activities
Check out these infographic activities from our guides on Health and Wellness, Renewable Energy, and Periodic Table Elements.
,
Bringing infographics into your classroom is the perfect way to help those students who like or need visual aids and puts an extra tool in their education toolbox to keep learning and growing!
How to Use Infographics for Data Communication and Storytelling
Step 1: Define the Purpose and Audience
Clarify the purpose of your infographic: Is it to inform, persuade, or engage? Consider the target audience: What level of knowledge and interest do they have?
Step 2: Gather and Analyze Relevant Data
Collect accurate and reliable data related to your topic. Analyze and interpret the data to identify key insights or trends.
Step 3: Determine the Story and Narrative
Craft a compelling narrative that connects the data points and tells a cohesive story. Identify the main message or takeaway you want to convey through your infographic.
Step 4: Choose the Right Visual Elements and Design
Select appropriate visual elements, such as charts, graphs, icons, and illustrations, to represent the data effectively. Design the infographic layout in a visually appealing and organized manner, ensuring clarity and readability.
Step 5: Simplify and Streamline the Information
Present the data in a concise and simplified manner, avoiding unnecessary complexity. Use clear headings, labels, and annotations to guide the viewer's understanding of the information.
Step 6: Engage and Connect with the Viewer
Use color, typography, and visual hierarchy to create visual interest and guide the viewer's attention. Incorporate storytelling techniques, such as using relatable examples or personal narratives, to engage the viewer on an emotional level.
Frequently Asked Questions About Using Infographics in the Classroom
Why use infographics in the classroom?
Infographics can be used to simplify complex information, make data more accessible, and engage learners visually. They also promote critical thinking and information literacy skills.
What are some examples of topics that can be represented in an infographic?
Almost any topic can be represented in an infographic, from historical events to scientific concepts, social issues, and more. Examples include the water cycle, the solar system, the branches of government, and human anatomy.
How can infographics be integrated into lesson plans?
Infographics can be used as an introduction to a topic, as a way to reinforce learning, or as a tool for assessment. Teachers can also have students create their own infographics to demonstrate their understanding of a topic.
How can infographics be used to promote media literacy?
Infographics can be used to teach learners about data literacy, visual literacy, and information literacy. By analyzing infographics, learners can gain an understanding of how data is presented and manipulated, and develop critical thinking skills.
Pricing for Schools & Districts
© 2024 - Clever Prototypes, LLC - All rights reserved.
StoryboardThat is a trademark of Clever Prototypes, LLC, and Registered in U.S. Patent and Trademark Office


